Data and Report
Created by
Created by
Year in Review
Kindly Sponsored by
Kindly Sponsored by

Raimund__Koch-landscape.jpg)
Raimund__Koch_portrait-4.jpg)


For many people, 2020 will be remembered as the year that nothing went to plan. The same can be said for the tall building industry. As a global pandemic took hold in the first quarter, numerous projects around the world, at various stages, ground to a halt as restrictions on assembly came into force. It is therefore not surprising that 2020 yielded 106 completions of buildings 200 meters and taller, a 20 percent decline from 133 in 2019, and nearing a level last seen in 2014, when 105 such buildings were constructed.
This is the second year in a row in which the completion figure declined. In 2019, the reasons for this were varied, though the efforts of China to curtail its debt, combined with public policy statements against needless production of exceedingly tall buildings, constituted a strong factor that has persisted into 2020.
Interactive graphic: please hover over columns to explore further.
The tallest building to complete in 2020 was Central Park Tower in New York City, at 472 meters. This is the first time in five years in which the tallest completed building was not in China, and the first time since 2014, when One World Trade Center completed, that the tallest building of the year was in the United States.
This is also the first year since 2014 in which there has not been at least one building taller than 500 meters completed.
Year in Review
Kindly Sponsored by
Schindler building*
As with most other enterprises, the degree to which the COVID-19 pandemic directly affected the construction schedule of a tall building in 2020 was highly variable in relation to local regulations and the ability of the contractor to keep a sufficient number of workers on-site. CTBUH is anecdotally aware of nine projects across Malaysia, India and Brazil whose completion schedules were pushed into 2021 as a direct consequence of COVID-19. There were mandated work stoppages in cities such as New York and San Francisco, though these could not be traced to any specific delays. As tall buildings are often lagging economic indicators, any chilling effect that economic conditions or work interruptions may have had on new project starts, or projects that were under construction in 2020 and were scheduled to be completed in 2021 or later, remains to be seen. It must be remembered, the economic crisis of 2008 was not reflected on skylines, in terms of lower completion rates, until 2010 and 2011.
It can be assumed that many more projects than discussed previously encountered difficulties due to COVID-19, if indirectly. One project in New York became embroiled in a zoning dispute. Work on Baku Tower was halted due to Azerbaijan’s military conflict with Armenia.
China alone still completed more than half the total buildings in the study (56), down from 57 in 2019 and 92 in 2018.
Asia (excluding the Middle East) accounted for 66 percent of the global total, compared to a 69 percent share in 2019.
The second-most prolific country was the United Arab Emirates, which completed twelve 200-meter-plus buildings, followed by the United States with 10, and the United Kingdom with five.
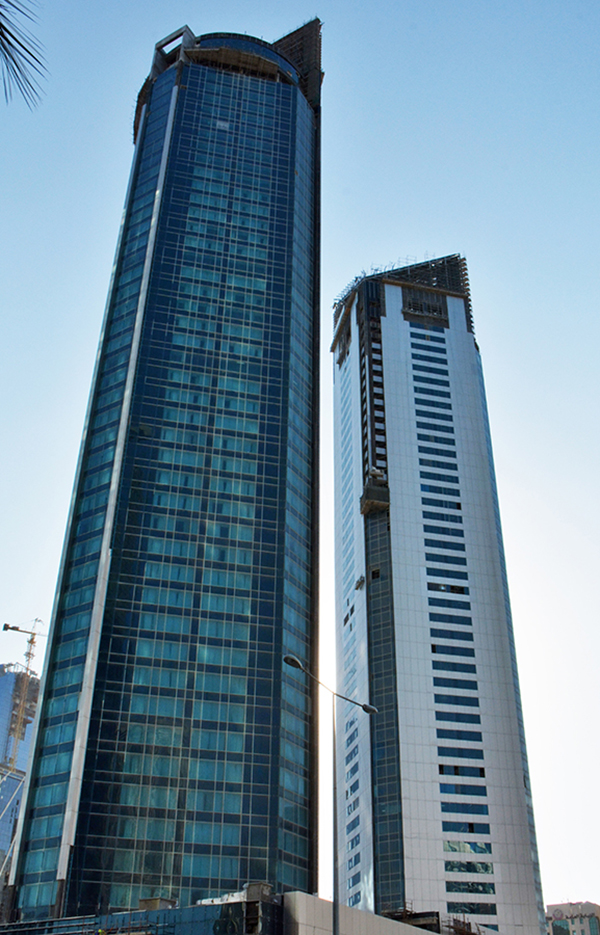
India completed three 200-meter-plus buildings in 2020, all of which are in Mumbai, and two of which, World One and World View, are in the same complex, and are the city’s and country’s new first- and second-tallest buildings.
Mexico had two entries in the 200-meter-plus club, with Monterrey, the northern industrial capital and its well-heeled neighbor San Pedro Garza Garcia each contributing one completion. T.Op Torre 1 in Monterrey (305 meters), is the first supertall to complete in Mexico. It is notable that this occurred outside Mexico City, traditionally the locus of the nation’s tall building activity.
Interactive graphic: please hover over columns to explore further.
The most prolific skyscraper-building city this year was Dubai, with 12 completions, accounting for all of the UAE’s 200-meter-plus buildings and topping its 2019 total by three. The last time Dubai held this title was 2010, the year the world’s current tallest building, the Burj Khalifa, was completed.
This broke the streak of Shenzhen, which was the world-champion city four times in a row from 2015 to 2019. In 2020, Shenzhen completed nine such buildings, down from 18 in 2019, dropping the south China megacity to second place.
Interactive graphic: please hover over columns to explore further.
There were 16 cities to get a new tallest building, down from 19 in 2018 and 20 in 2019, as shown below.
Schindler building*
| Rank | Building Name | City | Floors | m | ft |
|---|---|---|---|---|---|
| 1 | Nanning China Resources Tower | Nanning, China | 87 | 403 | 1321 |
| 2 | Guiyang International Financial Center T1 | Guiyang, China | 79 | 401 | 1316 |
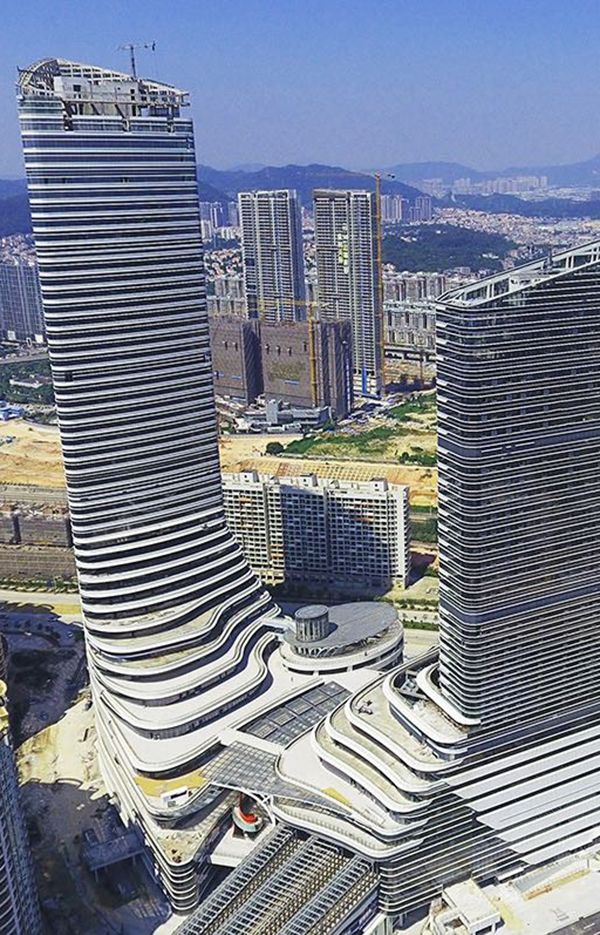
| 3 | Hengqin International Finance Center | Zhuhai, China | 69 | 338 | 1108 |
| 4 | Jinan Center Financial City A5-3 | Jinan, China | 69 | 333 | 1093 |
| 5 | Australia 108 | Melbourne, Australia | 100 | 317 | 1039 |
| 6 | T.Op Torre 1 | Monterrey, Mexico | 64 | 305 | 1002 |
| 7 | World One | Mumbai, India | 76 | 285 | 935 |
| 8 | One Barangaroo | Sydney, Australia | 71 | 271 | 890 |
| 9 | 99 Hudson Street | Jersey City, United States | 76 | 271 | 889 |
| 10 | R&F Riverside New City - Ritz-Carlton Hotel | Harbin, China | 56 | 270 | 885 |
| 11 | Landmark Tower | Haikou, China | 51 | 260 | 853 |
| 12 | Changchun International Finance Center Tower 1 | Changchun, China | 47 | 226 | 741 |
| 13 | Ganzhou Baoneng Center | Ganzhou, China | 43 | 218 | 715 |
| 14 | Dongying World Finance Center | Dongying, China | 48 | 215 | 705 |
| 15 | The Politan Aqua West Tower | Nonthaburi, Thailand | 61 | 214 | 703 |
| 16 | Deansgate Square South Tower | Manchester, United Kingdom | 66 | 200 | 658 |
New York City had the two tallest buildings to complete in 2020, Central Park Tower, at 472 meters, and One Vanderbilt, at 427 meters.
It is quite rare for one city to claim the tallest two buildings to complete in a given year – but this is the fourth time this has occurred in New York City for buildings 200 meters and higher. The first time, in 1930, the Bank of Manhattan Building (283 meters) briefly became the world’s tallest building, but was surpassed by a cleverly-disguised spire inside the crown of the Chrysler Building (319 meters), which was raised at the last minute to claim the title.
The second time was the year after – 1931, when the Empire State Building (381 meters) and Twenty Exchange (The City Bank Farmers Trust Building) (226 meters) were. The third was in 1963, when the MetLife (Pan Am) Building (246 meters) and 277 Park Avenue (209 meters) both completed. The two original World Trade Center towers (No. 1, North Tower, 417 meters, 1972; and No. 2, South Tower, 415 meters, 1973) completed in different years.
In the entire history of skyscraper construction, the two tallest buildings to complete in a given year (of 200 meters’ or greater height) have only occurred in the same city on 10 occasions. Other cities to have had this distinction include Chicago (1969 and 1989), Houston (1982 and 1983), Kuala Lumpur (1998), and Dubai, in 2000.
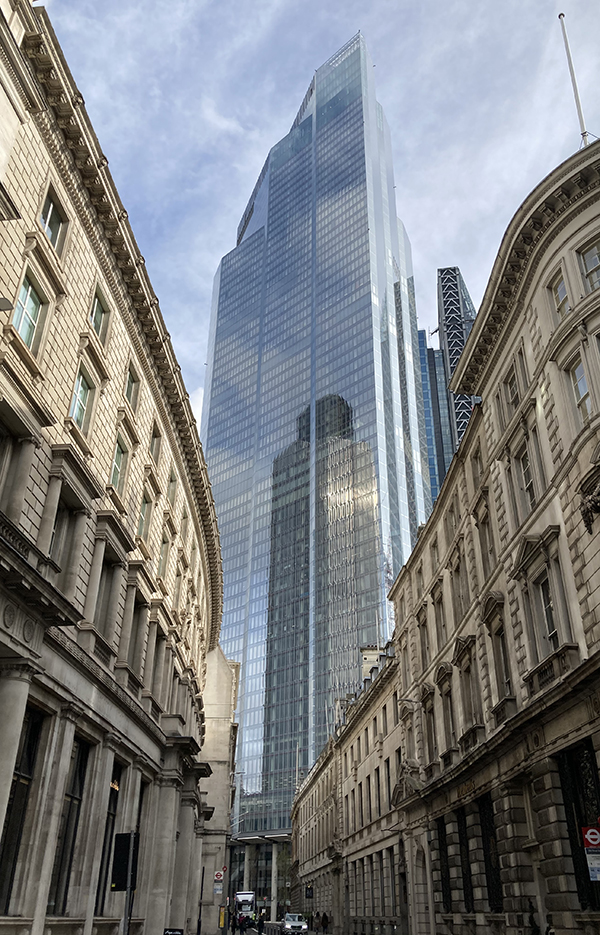
In 2020, London completed four buildings over 200 meters – the most in any year – despite shadows hanging over the city as the UK moves to finalize its exit from the European Union, which is expected to reduce office demand. London had only completed five such buildings before in its entire history, and never more than one in a year. Three of the four are in Canary Wharf, the financial district purpose-built to kick off London’s “Big Bang” of financial deregulation in the mid-1980s, turning it into the finance world’s front door to Europe. Notably, three of the four are residential or combination residential/hotel towers (and all in Canary Wharf), and only one, Twentytwo is an office building in London’s traditional financial center, the City.
Not to be outdone, Manchester had something of a tower boom as well. Deansgate Square South Tower topped out at 200.5 meters, giving Manchester a new tallest building, besting the 169-meter Beetham Tower, completed in 2006.
Interactive graphic: please hover over chart to explore further.
From a regional perspective, the relative share of the 100 tallest buildings in North America grew slightly year-on-year, while Asia’s share held steady. In 2020, North America represented 14 percent of the world’s 100 tallest buildings (up 1 percent from 2019), with Asia accounting for 61 percent (unchanged from 2019) and the Middle East, 20 percent (down 2 percent from 2019). At the end of the previous decade, in 2010, the shares were 31 percent for North America, 42 percent for Asia, and 22 percent for the Middle East.
Interactive graphic: please hover over chart to explore further.
In terms of function, 36 percent of the 100 tallest buildings worldwide were office-only in 2020. Forty-nine percent were mixed use, 11 percent were residential, and 4 percent were hotel-only. The office and hotel shares were unchanged from 2019, but mixed-use declined by 2 percent and residential-only increased by 2 percent. In 2010, 61 percent of the world’s 100 tallest buildings were office-only, 24 percent were mixed-use, 5 percent were hotel-only, and 10 percent were residential.
Interactive graphic: please hover over chart to explore further.
With respect to materials, in 2020, the 100 tallest buildings were 9 percent all-steel construction (compared to 8 percent in 2019), 29 percent concrete (unchanged from 2019), 58 percent composite (1 percent lower than 2019), and 4 percent mixed structures (unchanged from 2019). A “composite” structure uses a combination of two or more materials in the main structural elements, such as concrete-filled steel tubes. A “mixed” structure uses two distinct systems, one on top of the other. In 2010, the share of all-steel buildings in the tallest 100 was 23 percent; concrete represented 40 percent of the total; 31 percent were composite structures; 5 percent were mixed and 1 building was marked as “unknown.”
The prevailing trends of the past decade have continued to manifest in 2020, with some minor variations. There has been a general trend toward greater use of composite structures and a mix of uses in the 100 tallest buildings since at least 1980. Both of these trends can be seen as reflections of owner/developers’ risk-limiting exercises. Using combinations of steel and concrete plays to the strengths of both of those materials, while offsetting the weaknesses.
Likewise, given the long lead times and great expense involved in planning and constructing tall buildings, particularly the very tallest, having a variety of uses spread throughout the building means that volatility in one market sector will not solely determine the fate of the building’s profitability. The two most relevant examples recently were the 2008 financial crash, which heavily affected residential financing and construction, and the current questions around how much office space the world will need, and how quickly business and leisure hotel occupancy demand will recover, once COVID vaccines are widely available.
The year-to-year variations are not as significant as the decade-by-decade trends, due to the long lead times as mentioned above. It is interesting that North America as a region increased its share of the 100 tallest between 2019 to 2020, but at one percent across one year, it is not statistically significant. The significant trend lines will become obvious closer to 2030.
Interactive graphic: please hover over chart to explore further.
The average height of the 20 tallest buildings declined to 351 meters, down from 377 meters in 2019 (the highest figure recorded in 20 years). The average height of all buildings 200 meters and higher to complete in 2020 was 254 meters, down from 264 meters in 2019 (which was also a 20-year record high at the time).
As mentioned above, it is reasonable to assume that far more projects were affected by the COVID-19 pandemic than the nine projects CTBUH was able to confirm. Yet this is also the second year in which a decline in the number of completions was recorded, so COVID-19 is not the only cause. Individual cases of financial difficulty happen each year, as do conflicts with local citizen groups or governments over zoning or other permissions. Warfare, while less common, was in 2020 implicated in at least one project (Baku Tower, Baku, Azerbaijan) not completing on schedule.
While the revelation of new strictures in China made headlines earlier this year, it is not likely to have affected the 2020 total, which is only one building less than was completed in 2019. The more prodigious drop in production of 200-meter-plus buildings, from 92 to 57, had already occurred between 2018 and 2019. Nevertheless, the combination of earlier directives counseling against “oversized, xenocentric, and weird” buildings issued in 2016, as well as subsequent local height restrictions have likely conspired to slow the march of exceedingly tall building construction in China, compared to the peaks reached mid-decade.
On the positive side, however, United Arab Emirates is seeing a resurgence, recording more completions (12) than in any year since 2011 (14). The UAE had nine completions in 2019 and 10 in 2018. Considering that the US records were 14 completions in both 2018 and 2019, and the relative sizes of the two economies, this is an impressive output by any measure.
Based on current counts, CTBUH predicts that between 125 and 150 buildings of 200 meters’ or greater height will be completed in 2021. Of these, between 14 and 30 will likely be supertalls (buildings of at least 300 meters’ height).
Looking at the top 30 projected completions in 2021, 18 are in China, five are in the United States, and three are in Saudi Arabia. All of the buildings coming online in Riyadh next year are part of the massive King Abdullah Financial District (KAFD), which will comprise some 50 buildings upon completion, though it would be pure speculation to estimate a completion date for the entire complex. In any case, 11 will have completed by the end of 2020, and its signature landmark, the 385-meter PIF Tower, will be among the Class of 2021, in any case. Notable regional highlights include the Central Asian cities of Baku, Azerbaijan, where the war-delayed Baku Tower looks set to complete in 2021; and Nur-Sultan, Kazakhstan, where Abu Dhabi Plaza is likely to complete. Both of these would become the tallest buildings in their respective countries.
It is reasonable to predict that COVID-19 will affect investment and construction for some time to come. It is already the case that some projects expected to have completed by the end of 2021 are being moved to 2022, including the 644-meter Merdeka PNB118 in Kuala Lumpur, a change that its developers have directly attributed to Malaysia’s Movement Control Order, which the country issued in response to the pandemic.
Having said this, it is notable that the two tallest buildings estimated to complete in 2021, Riverview Plaza A1, Wuhan (436 meters), and 111 West 57th Street, New York City (435 meters), are in the two cities that were, by many measures, hit hardest and earliest by the 2020 pandemic. This could be taken as a symbol of the resilience of cities and the tall building industry as well. It is also possible that the availability of vaccines and other positive developments in the battle against the pandemic will restore confidence by mid-year, which gives CTBUH additional confidence in the predicted range of 125 to 150 completions for 2021.
Raimund__Koch.jpg)
Hao__Li.jpg)
Lodha__Group-crop.jpg)
Canary__Wharf__Group.jpg)
Canary__Wharf__Group.jpg)
Foster+Partners.jpg)