In 2021, there were a total of 119 buildings 200 meters or higher completed. This is down slightly from 122 in 2020. This is the third year in a row in which the completion figure declined; there were 146 such buildings completed in 2019.
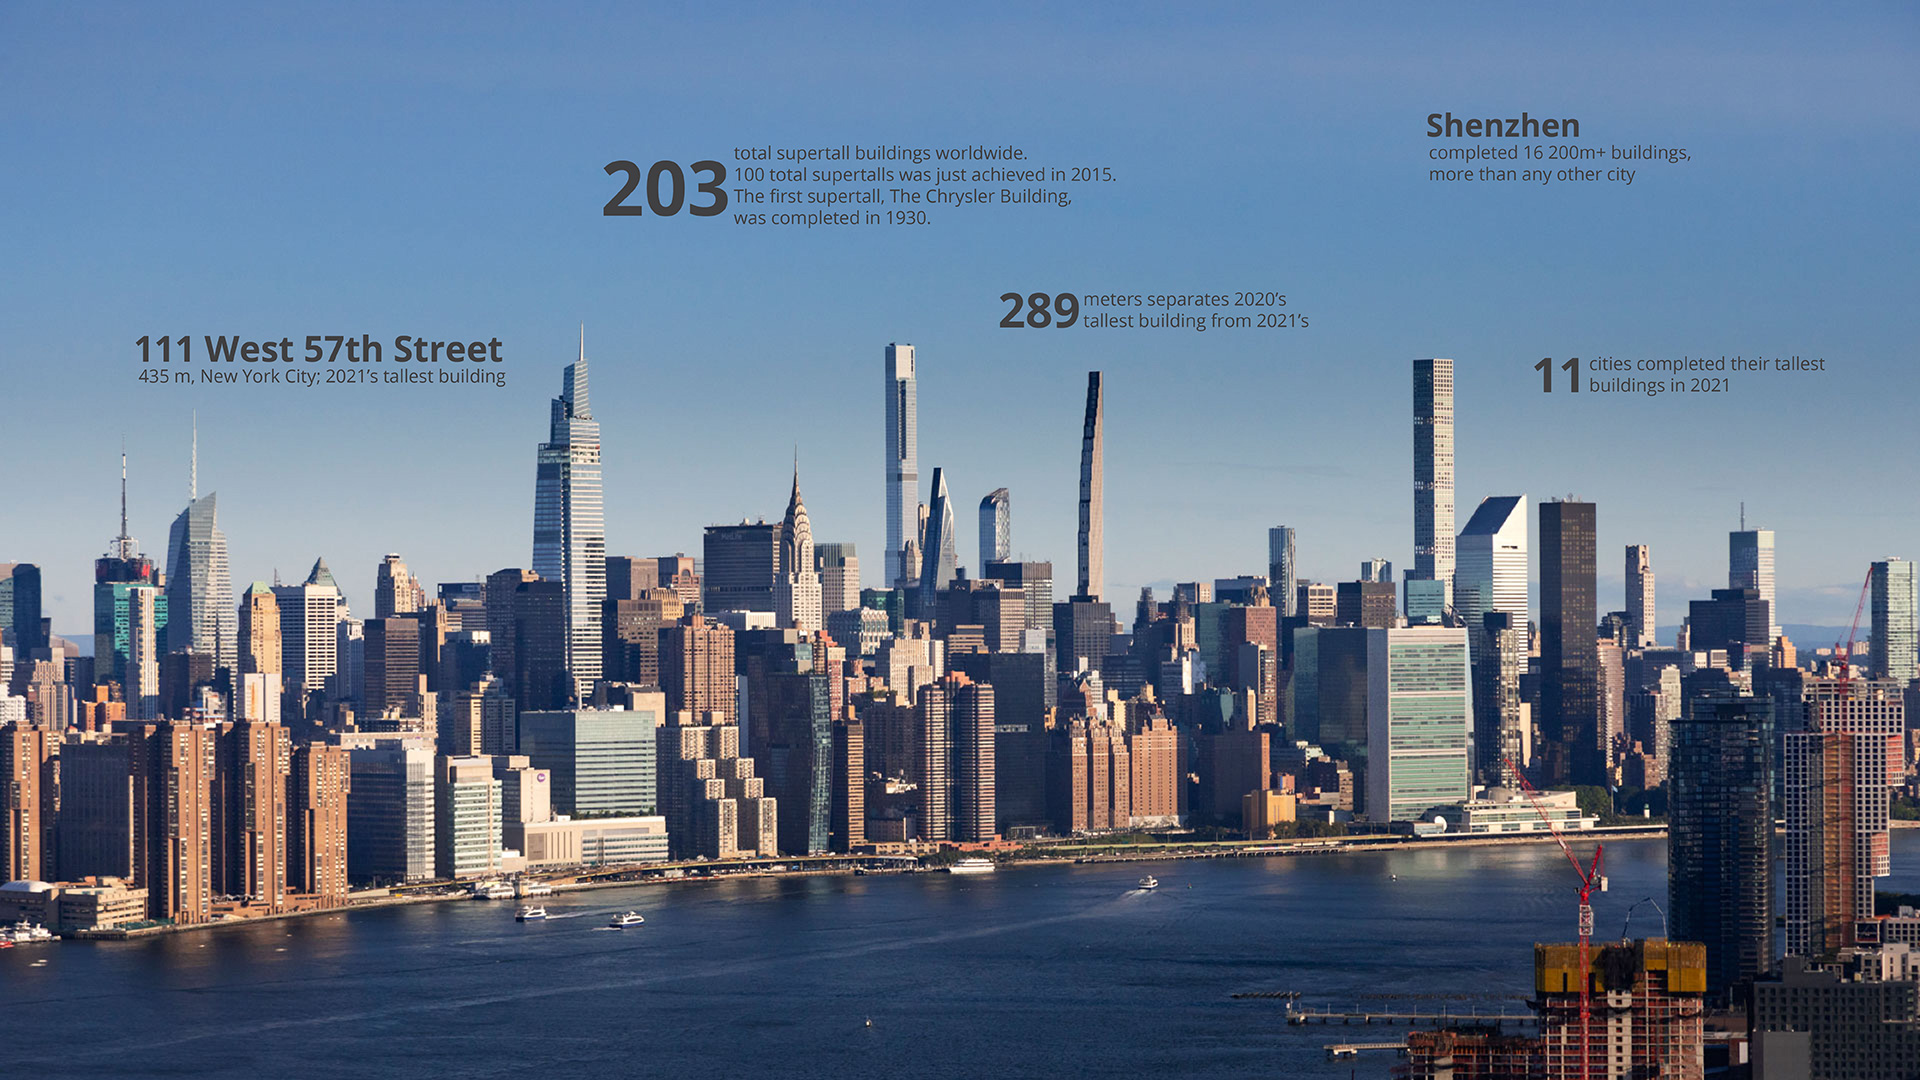
Notably, 2021 marks the year the world accumulated 200 total supertall buildings (300 meters or taller). For perspective, the 100-supertall number was first hit in 2015. Since the completion of the first supertall in 1930, The Chrysler Building (319 meters), it took 85 years to reach that number, but only six more years to double that figure. There were 1,922 buildings of 200 meters or greater height at the end of 2021, and this count is expected to surpass 2,000 buildings by the end of 2022.
Interactive graphic: please hover over columns to explore further.
The tallest building to complete in 2021 was 111 West 57th Street, in New York City, at 435 meters. This is the second year in a row that New York has had the tallest annual completion. Both 111 West 57th Street and Central Park Tower (472 meters, 2020 – the tallest building to complete in that year) are located along “Billionaire’s Row,” a parade of particularly tall and thin luxury residential skyscrapers along the south edge of Central Park.
As successive pandemic waves swept the globe throughout 2021, again construction sites were periodically brought to a halt in some of the more strictly controlled jurisdictions, though it is not clear whether this affected the number of completed buildings ultimately. As vaccines began to be introduced at the beginning of 2021, there were fewer mandated work stoppages than in the previous year. CTBUH knows of no projects that were abandoned entirely, and specifically due to the pandemic, which has provoked much debate about the future of the office building, but so far has not resulted in the general market slowdown that some expected.
As has been the case for the better part of two decades, China completed the most 200-meter-plus buildings in 2021, recording 64 buildings, down from 68 in 2020. The United States followed with nine completions, with Australia recording eight, followed by Malaysia with six and then India, and the United Arab Emirates, each with five. The number of countries completing a 200-meter-plus building grew to 21, up from 16 in 2020, but down from 22 in 2019.
Interactive graphic: please hover over columns to explore further.
The most prolific skyscraper-building cities were mostly, though not entirely in accordance with national totals. The leading city for completions of buildings 200 meters and higher was Shenzhen, with 16, up significantly from nine in 2020. This marks a resurgence for Shenzhen, which was the world-champion city five times in a row from 2015 to 2019, losing the crown temporarily to Dubai in 2020. The second prize goes to Melbourne, with six completions, the most that city has completed in any year. The past year marked the eighth year in a row in which Melbourne has completed at least one 200-meter building.
With the continued rapid pace of construction in Shenzhen, the city now has 120 completed buildings of at least 200 meters in height. The only other city the world exceeding 100 such buildings within the total inventory is Dubai at 107, followed by New York City in third place at 91. While these figures are impressive, it should be noted having this many buildings of at least 200 meters in height within a single city is rather unusual from a global perspective. Tokyo, among the largest cities in the world, by comparison had 31 buildings of at least 200 meters in height completed by the close of 2021, which is only two more than the spread between the completed inventories of New York and Shenzhen.
Interactive graphic: please hover over columns to explore further.
All six of Malaysia’s 200 meter completions were in Kuala Lumpur while Dubai, Mumbai, New York City and Qingdao all tied at five 200-meter-plus building completions (with New York recording the same number as in 2020). This is the highest number of completions Qingdao has ever recorded. And Mumbai picked up the rhythm it established in 2019, when it completed six 200-meter-plus buildings, its highest number ever.
There were 11 cities to get a new tallest building, as shown below.
| Rank | Building Name | City | Floors | m | ft |
|---|---|---|---|---|---|
| 1 | Minying International Trade Center T2 | Dongguan, China | 85 | 423 | 1,386 |
| 2 | PIF Tower | Riyadh, Saudi Arabia | 72 | 385 | 1,263 |
| 3 | Qingdao Hai Tian Center | Qingdao, China | 73 | 369 | 1,210 |
| 4 | Hangzhou Centre Tower A | Hangzhou, China | 63 | 293 | 961 |
| 5 | Tiantou International Business Center 1 | Chengdu, China | 59 | 284 | 932 |
| 6 | The Mega Tower | Mandaluyong, Philippines | 50 | 250 | 819 |
| 7 | Sail Tower | Jeddah, Saudi Arabia | 64 | 240 | 787 |
| 8 | Crescent City Office Building | Baku, Azerbaijan | 52 | 210 | 689 |
| 9 | Commercial Bank of Ethiopia | Addis Ababa, Ethiopia | 46 | 209 | 687 |
| = 10 | Resorts World Las Vegas Tower I | Las Vegas, United States | 57 | 205 | 674 |
| = 10 | The Peak Residential Tower 1 | Phnom Penh, Cambodia | 55 | 205 | 672 |
The number of cities completing a 200-meter-plus building held steady from 2020 to 2021, at 51, down from a peak of 68 in 2017. Several cities recorded their first 200-meter buildings in 2021: Phnom Penh (and Cambodia), with the twin Peak Residential Towers (205 meters); Baku (and Azerbaijan as well), with Crescent City Office Building at 210 meters; Addis Ababa (and Ethiopia as well), with Commercial Bank of Ethiopia, at 209 meters; and Las Vegas metropolitan area, with Resorts World Las Vegas Tower I (205 meters). These were just four of the 11 cities that completed construction of their new tallest buildings in 2021.
Interactive graphic: please hover over columns to explore further.
Houston saw a 200-meter completion for only the second time since 1996, with Texas Tower (224 meters). This is significant, because Houston completed 12 such buildings in a 10-year span during the oil boom years of 1978 to 1987, which has since visually defined much of the downtown skyline, but has seen little adjustment to the inventory of tallest buildings since that time. Interestingly, the 1996 completion was Centerpoint Energy Plaza (226 meters, 53 floors) – itself a renovation and height increase of 1100 Milam (199 meters, 47 floors), constructed in 1973.
Interactive graphic: please hover over columns to explore further.
From a regional perspective, Asia’s share of the world’s 100 tallest buildings continued to hold at 59 percent, for the third year in a row. North America’s share increased to 17 percent from 14 percent in 2020, while the Middle East slid to 19 percent, down from 20 percent in 2020 and 22 percent in 2019.
Interactive graphic: please hover over columns to explore further.
In terms of function, 36 percent of the 100 tallest buildings worldwide were office-only in 2021, the same as in 2020. Fifty percent were mixed-use, 11 percent were residential, and 3 percent were hotel-only, all unchanged from 2020 – and office and hotel functions have remained at a constant percentage for three years.
Interactive graphic: please hover over columns to explore further.
The proportion of the 100 tallest buildings whose primary structural system is steel continues to decline, dropping to 7 percent in 2021, down from 9 percent in 2020. Concrete retains a 29 percent share, which it has held since 2019. The proportion of composite structures rose to 59 percent, from 58 percent in 2020. Mixed structures constituted 5 percent of the 100 tallest buildings at the end of 2021, a figure unchanged since 2019. A “composite” structure uses a combination of two or more materials in the main structural elements, such as concrete-filled steel tubes, while a “mixed” structure uses two distinct systems, one on top of the other.