The
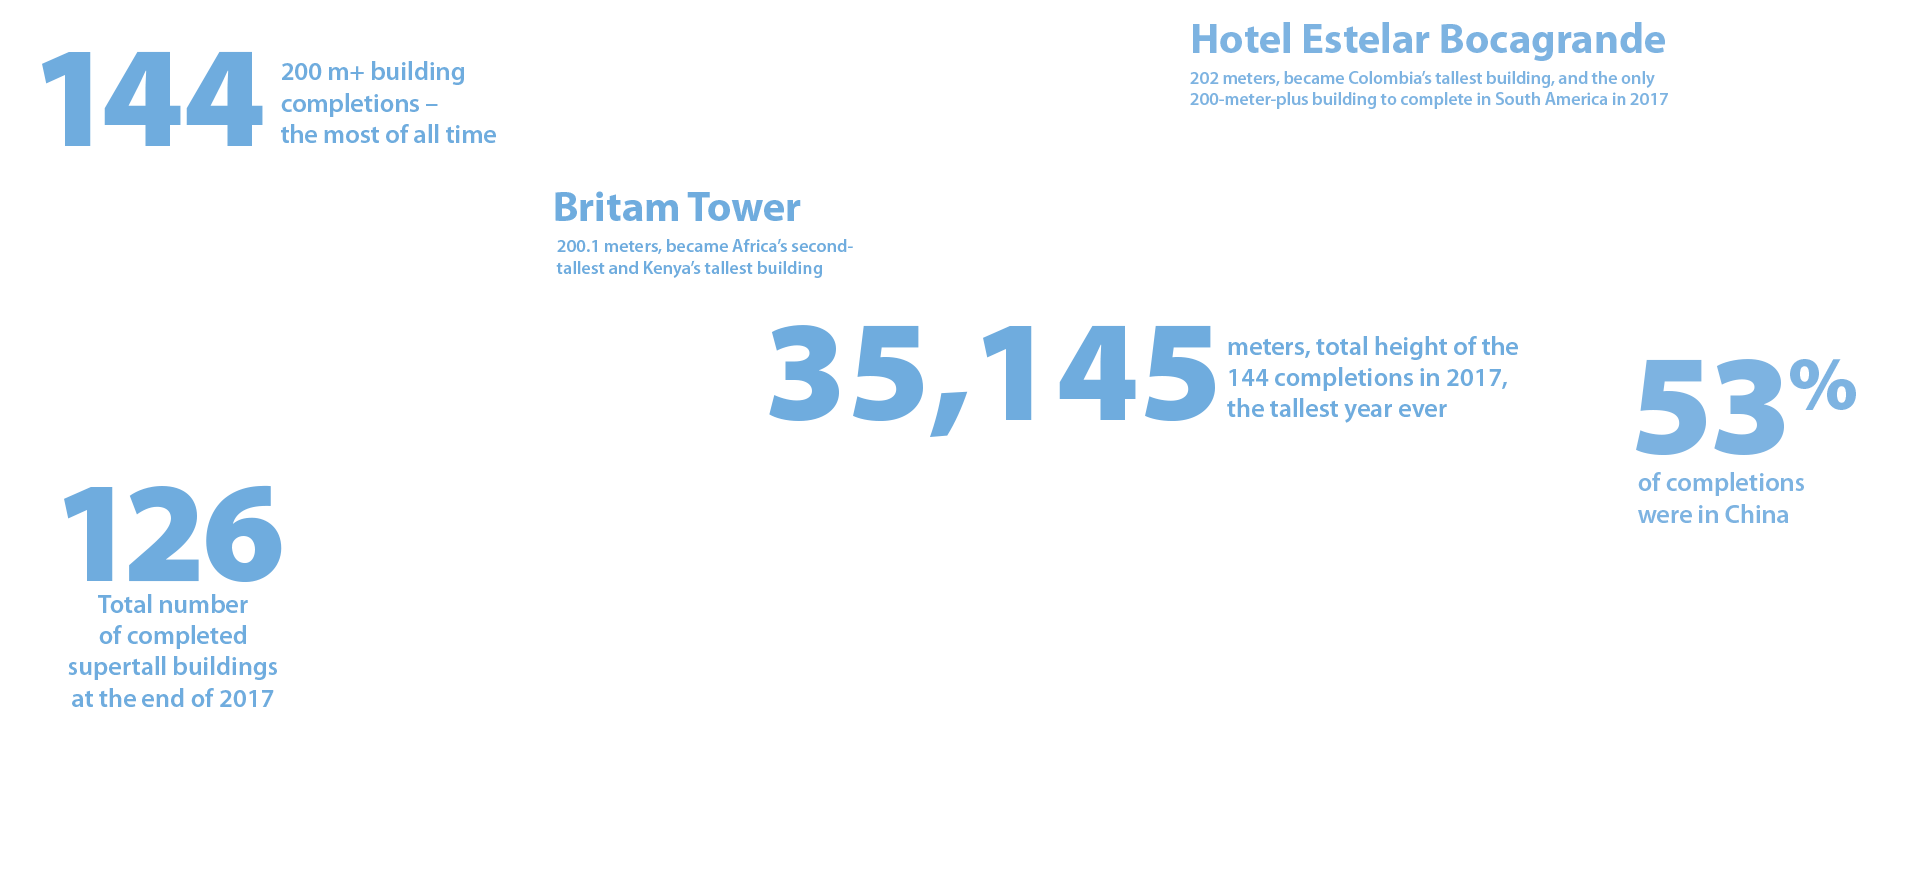
144 buildings completed in 2017 beat every previous year on record, including the previous record high of 127 completions in 2016. This brings the total number of
200-meter-plus buildings in the world to 1,319, increasing 12.3% from 2016, marking a 402% increase from the year 2000, when only 263 existed. A total of
15 supertalls (buildings of 300 meters or higher) were completed in 2017, tying with 2015, the first year to break this record. The total number of supertall buildings worldwide is now 126, up from 111 in 2016. This fact is even more extraordinary considering that much of the activity has been in the past few years. The 2017 figure represents a 66% increase in just four years. In 2013, there were 76 buildings 300 meters or higher.
Note: Only countries with at least three completions in 2017 are included in this chart. Two tall buildings of 200 meters
in height or greater were completed in these countries: Australia, Israel, Japan, Panama, Saudi Arabia, Singapore and Thailand. One 200 m+ tall building was also completed
during 2017 in these countries: Colombia, Kenya, Mexico, Qatar, and Sri Lanka.
For the 10th year running,
China
had the most 200-meter-plus completions with 76, representing 53% of the global 2017 total. Although still the world champion by a wide margin, this is a reduction from 2016, when
China had 83 completions, for 65% of that year’s total.
The United States took second place with 10 completions, and South Korea followed closely with seven. Meanwhile, Canada and Indonesia tied for fourth place with five completions each; while Malaysia, North Korea, Turkey and the United Arab Emirates tied for fifth place with four completions each.
Note: Two or fewer tall buildings 200 m+ in height were also completed during 2017 in these cities: Nanchang, Bangkok, Chicago, Chongqing, Dongguan, Guangzhou, Hefei, Melbourne, Nanjing, Panama City, Riyadh, Shenyang, Singapore, Tokyo, Xi’an, Zhengzhou, Abu Dhabi, Baoji, Beijing, Calgary, Cartagena, Colombo, Dalian, Doha, Foshan, Fuzhou, Giv'atayim, Hong Kong, Houston, Huizhou, Izmir, Johor Bahru, Lanzhou, Lianyungang, Liuzhou, Los Angeles, Nairobi, Nantong, Philadelphia, San Pedro Garza Garcia, Sanya, Seattle, Suzhou, Tel Aviv, Tianjin, Xiamen, Xuzhou, Yantai, Yinchuan, Zhanjiang, and Zhuhai.
For the second year in a row, Shenzhen had the highest number of 200-meter-plus completions of any city in 2017 with 12 (once again, more than any country other than China managed to complete), while China’s Nanning took second place with seven completions and Chengdu tied Indonesia’s Jakarta with five. This year was remarkable in that the number of cities with at least one 200-meter building completion jumped to 69, from 54 in 2016.
Asia retained its status as the world’s skyscraper epicenter in 2017, completing 109 buildings, representing 76% of the 144-building total. This is an increase from the 105 total, but a small decline from the 83% share held in 2016.
The Middle East matched its average of 2015 and 2016 numbers with nine completions in 2017. North America more than doubled its record for 2016, with 15 completions. Europe doubled its 2016 output with four buildings of 150 meters’ or greater height. Central America had three completions for 2% of the world total, while Oceania had two completions, and Africa and South America had one each.
The functional share of tall buildings in 2017 proved to be among the most interesting discoveries in the study. Completed buildings with all-office functions fell to 56, or 39% of the total, compared to 67, or 52% of completions in 2016. Meanwhile, buildings with all-residential functions spiked to 49, or 34% of the total, from just 19, or 15% of the total in 2016. The proportion of tall buildings 200 meters and higher with mixed functions was reduced to 26% from 30% in 2016, although the raw number, 38, remained the same. Continuing the trend from last year, only one all-hotel building was completed in 2017. The reasons for this are not clear. It is tempting to speculate that we are now seeing the built results of a full-blown recovery from the 2008 economic crisis, as greater confidence in single-function programs sparks a resurgence in speculative residential development. Further, there has been growing interest over the past several years in residential real-estate investment by absentee owners as a wealth management strategy. However, market dynamics vary greatly between nations and regions, so it’s likely there are other factors in the story.
Of the 144 buildings of 200 meters or greater height completed in 2017, 74, or 51%, used concrete as the main structural material; while 64, or 44% used a composite of steel and concrete. The significant use of concrete can be attributed to a combination of concrete’s relative ubiquity and lower cost in many regions, as well as its comparative simplicity in construction, which would increase its appeal in regions with lower-skilled labor pools. In 2017, two buildings had all-steel construction, consistent with the 2016 figure. As of this writing, there were only seventeen 200-meter-plus buildings currently under construction that employed all-steel structural systems. Of course, it needs to be remembered that concrete construction normally contains substantial amounts of steel reinforcement bar (rebar), and that “composite” construction uses differing proportions of structural steel and concrete, playing to the strengths of each under different force conditions.
The distribution of the World’s 100 Tallest buildings broadly reflects that of the wider set of 200 meter-plus buildings worldwide. Asia leads with 54, followed by the Middle East with 26, North America with 15, and Europe with four.
Mixed-use functions continue to dominate the functional mix of the tallest 100 buildings, with 46 buildings, an increase from 41 in 2016. Meanwhile, office functions take a slightly lower share in 2017, with 38 buildings, down from 40 in 2016 and equal to the 2015 figure. Residential and hotel functions have shrunk as a proportion once again, with 11 and five buildings, respectively, down from 12 and seven in 2016.
The 100 Tallest list continues to be dominated by composite construction, with 51 buildings employing composite systems, equal to the 2016 numbers. All-concrete buildings decreased by one to 34 from 35 in 2016. Those buildings reported as being of “mixed” construction, in which distinctive sections of the buildings are predominantly steel or concrete, increased to five in 2017, from four in 2016.
Skyline: Tallest Building by Year
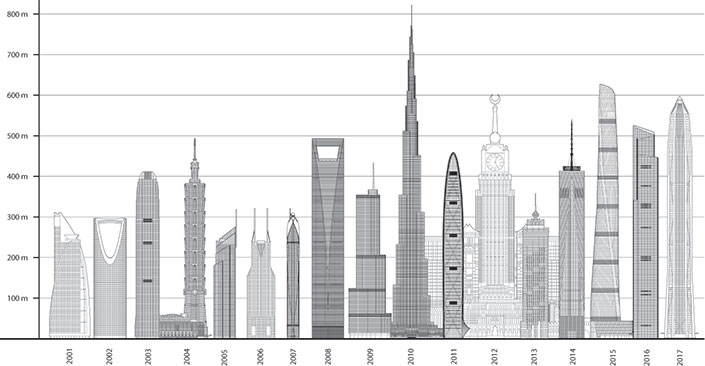
Ping An Finance Center, Shenzhen, was the tallest building to complete in 2017, at 599 meters. It is now the second-tallest building in China, and the fourth-tallest building in the world.
Skyline: Tallest 2017 Completions
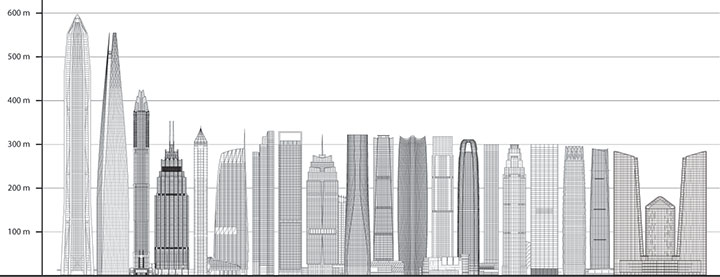
The average height of 200 meter-plus buildings completed in 2017 was 244 meters, up from 238 meters in 2016. The average height of the World’s 100 Tallest Buildings continues to climb, hitting 372 meters in 2017, up from 363 meters in 2016. Meanwhile, the average height of the 20 tallest 200 meter-plus completions in 2017 has hit a new record high of 348 meters, up from 316 meters in 2016.
In 2017, 144 buildings of 200 meters’ height or greater were completed, setting a new record for annual tall building completions and marking the fourth consecutive record-breaking year. This brings the total number of 200-meter-plus buildings in the world to 1,319, increasing 12.3% from 1,175 in 2016, and marking a 402% increase from the year 2000, when only 263 existed.
While many of the trends in the 2017 report represent continuations of those observed in previous years, one marked difference is the widening range of geographic diversity in terms of where 200-meter-and-taller buildings are located. A total of with 69 cities across 23 countries are represented in the data, up from 54 cities across 18 countries in 2016 , suggesting increasing urbanization levels around the world.
A total of 15 supertalls completed in 2017 – more than any year previous – but only 14 entered the 100 Tallest list, indicating that the threshold for being included in the 100 Tallest keeps rising (See Average Building Height).
List of 2017 Completions
| Rank | Building Name | City | Stories | m | ft |
|---|
| 1 | Ping An Finance Center | Shenzhen, China | 115 | 599 | 1965 |
| 2 | Lotte World Tower | Seoul, South Korea | 123 | 555 | 1819 |
| 3 | Marina 101 | Dubai, United Arab Emirates | 101 | 425 | 1394 |
| 4 | The Address Boulevard | Dubai, United Arab Emirates | 73 | 370 | 1214 |
| 5 | Ahmed Abdul Rahim Al Attar Tower | Dubai, United Arab Emirates | 76 | 342 | 1122 |
| 6 | Wilshire Grand Center | Los Angeles, United States | 62 | 335 | 1100 |
| 7 | Yuexiu Fortune Center Tower 1 | Wuhan, China | 69 | 330 | 1083 |
| 8 | Hon Kwok City Center | Shenzhen, China | 80 | 329 | 1081 |
| 9 | Yantai Shimao No. 1 The Harbour | Yantai, China | 59 | 323 | 1060 |
| 10 | Zhuhai St. Regis Hotel & Office Tower | Zhuhai, China | 61 | 323 | 1059 |
| 11 | Guangxi Finance Plaza | Nanning, China | 68 | 321 | 1053 |
| 12 | Sinar Mas Center 1 | Shanghai, China | 65 | 320 | 1050 |
| 13 | Jiuzhou International Tower | Nanning, China | 71 | 318 | 1043 |
| 14 | Poly Pazhou C2 | Guangzhou, China | 61 | 311 | 1020 |
| 15 | Huachuang International Plaza Tower 1 | Changsha, China | 66 | 300 | 984 |
| 16 | Jin Wan Plaza 9 | Tianjin, China | 66 | 300 | 983 |
| 17 | Shum Yip Upperhills Tower 2 | Shenzhen, China | 62 | 299 | 982 |
| 18 | China World Trade Center Phase 3B | Beijing, China | 59 | 296 | 970 |
| 19 | Concord International Centre | Chongqing, China | 64 | 290 | 951 |
| = 20 | Skyland Office Tower | Istanbul, Turkey | 65 | 284 | 932 |
| = 20 | Skyland Residential Tower | Istanbul, Turkey | 64 | 284 | 932 |
| = 22 | Greenland Zhengzhou Central Plaza North Tower | Zhengzhou, China | 63 | 284 | 931 |
| = 22 | Greenland Zhengzhou Central Plaza South Tower | Zhengzhou, China | 63 | 284 | 931 |
| = 24 | Metropol Tower Istanbul | Istanbul, Turkey | 58 | 280 | 919 |
| = 24 | China Resources Center 2 | Hefei, China | 65 | 280 | 919 |
| 26 | Bodi Center Tower C | Hangzhou, China | 57 | 280 | 918 |
| 27 | Torre KOI | San Pedro Garza García, Mexico | 65 | 279 | 916 |
| 28 | Ryomyong Street Apartment Building | Pyongyang, North Korea | 82 | 270 | 886 |
| = 29 | Suning Plaza Tower A | Xuzhou, China | 62 | 266 | 873 |
| = 29 | One Avighna Park | Mumbai, India | 64 | 266 | 873 |
| 31 | New World Centre | Hong Kong, China | 63 | 265 | 869 |
| 32 | Menara Astra | Jakarta, Indonesia | 50 | 262 | 858 |
| 33 | Vanke Chang'an Center | Dongguan, China | 60 | 260 | 853 |
| 34 | One Bloor Street East | Toronto, Canada | 75 | 257 | 844 |
| = 35 | Raffles City Hangzhou Tower 1 | Hangzhou, China | 61 | 256 | 841 |
| = 35 | Raffles City Hangzhou Tower 2 | Hangzhou, China | 59 | 256 | 841 |
| 37 | CITIC Ruibo Tower 1 | Shanghai, China | 55 | 256 | 840 |
| 38 | Trump Tower At Century City | Makati, Philippines | 58 | 251 | 822 |
| 39 | Banghua World Trade Center | Guangzhou, China | 55 | 250 | 820 |
| 40 | The Shang Salcedo | Makati, Philippines | 67 | 250 | 820 |
| 41 | Shenzhen University Subway Station Tower | Shenzhen, China | 51 | 249 | 817 |
| = 42 | Jinmao International Plaza Tower 1 | Changsha, China | 52 | 248 | 814 |
| = 42 | Jinmao International Plaza Tower 2 | Changsha, China | 52 | 248 | 814 |
| 44 | Brookfield Place Tower One | Calgary, Canada | 56 | 247 | 810 |
| = 45 | The-W 101 | Busan, South Korea | 69 | 246 | 808 |
| = 45 | The-W 102 | Busan, South Korea | 69 | 246 | 808 |
| = 45 | The-W 103 | Busan, South Korea | 69 | 246 | 808 |
| = 45 | The-W 104 | Busan, South Korea | 69 | 246 | 808 |
| 49 | Tencent Seafront Tower 1 | Shenzhen, China | 50 | 246 | 806 |
| = 50 | Changjiang Media Tower | Wuhan, China | 49 | 243 | 797 |
| = 50 | Setia Eco City - Vogue Suite One | Kuala Lumpur, Malaysia | 63 | 243 | 797 |
| = 52 | Sandy Federal Tower | Fuzhou, China | 55 | 240 | 787 |
| = 52 | Shuibei Jewelry Headquarters Tower 1 | Shenzhen, China | 48 | 240 | 787 |
| = 52 | Ryomyong Street 70-Storey Building | Pyongyang, North Korea | 70 | 240 | 787 |
| 55 | Menam Residence | Bangkok, Thailand | 59 | 239 | 785 |
| = 56 | Azrieli Sarona | Tel Aviv, Israel | 53 | 238 | 781 |
| = 56 | Hunan Daily Media Center | Changsha, China | 54 | 238 | 781 |
| = 56 | CITIC Ruibo Tower 2 | Shanghai, China | 52 | 238 | 781 |
| 59 | 50 West | New York City, United States | 64 | 237 | 778 |
| = 60 | Wuhan International Financial Plaza | Wuhan, China | 51 | 237 | 778 |
| = 60 | V on Shenton Residential Tower | Singapore, Singapore | 54 | 237 | 778 |
| 62 | Madison Square Park Tower | New York City, United States | 63 | 237 | 777 |
| 63 | Strait Pearl Plaza | Xiamen, China | 50 | 235 | 770 |
| 64 | Harbour Plaza Residences East | Toronto, Canada | 66 | 233 | 764 |
| 65 | Lihe Tower | Shenzhen, China | 48 | 231 | 757 |
| 66 | 609 Main at Texas | Houston, United States | 50 | 230 | 755 |
| = 67 | Rongchao Headquarters Tower | Shenzhen, China | 54 | 230 | 755 |
| = 67 | China Merchants Bank Tower | Nanjing, China | 48 | 230 | 755 |
| 69 | Grand Hyatt Colombo | Colombo, Sri Lanka | 47 | 230 | 753 |
| 70 | Lanzhou Center Office Tower | Lanzhou, China | 40 | 229 | 751 |
| 71 | Elite 500 Dos Mares | Panama City, Panama | 60 | 228 | 748 |
| 72 | Al Asmakh Tower | Doha, Qatar | 34 | 227 | 745 |
| 73 | Marina One | Singapore, Singapore | 30 | 225 | 740 |
| 74 | Coastal Center | Shenzhen, China | 46 | 225 | 738 |
| 75 | Shenyang New World Center Tower C | Shenyang, China | 57 | 224 | 736 |
| 76 | Harbour Plaza Residences West | Toronto, Canada | 62 | 224 | 735 |
| 77 | River Point | Chicago, United States | 52 | 223 | 732 |
| = 78 | World Crest | Mumbai, India | 57 | 223 | 730 |
| = 78 | FMC Tower at Cira Centre South | Philadelphia, United States | 49 | 223 | 730 |
| = 78 | 3 Manhattan West | New York City, United States | 64 | 223 | 730 |
| 81 | Optical Valley New World Center A | Wuhan, China | 44 | 222 | 729 |
| = 82 | Shenzhen Energy Headquarters North Tower | Shenzhen, China | 43 | 222 | 728 |
| = 82 | Tianxi Twin Towers 1 | Chengdu, China | 65 | 222 | 728 |
| = 82 | Tianxi Twin Towers 2 | Chengdu, China | 65 | 222 | 728 |
| = 82 | MARQUE Sukhumvit | Bangkok, Thailand | 50 | 222 | 728 |
| 86 | Suzhou Center Plaza 1 | Suzhou, China | 56 | 222 | 727 |
| 87 | 150 North Riverside | Chicago, United States | 50 | 221 | 724 |
| 88 | Landscape-Brilliant Center | Hefei, China | 50 | 221 | 723 |
| 89 | Telkom Landmark Tower 2 | Jakarta, Indonesia | 46 | 220 | 722 |
| = 90 | The Altus | Johor Bahru, Malaysia | 60 | 220 | 722 |
| = 90 | Yintai Center Tower 1 | Chengdu, China | 52 | 220 | 722 |
| = 90 | Horoy Times Square A | Shenzhen, China | 46 | 220 | 722 |
| = 90 | Kaisa Center Phase 3 | Huizhou, China | 45 | 220 | 722 |
| = 90 | Zhanjiang Fortune Meeting | Zhanjiang, China | 45 | 220 | 722 |
| = 95 | Light House | Melbourne, Australia | 69 | 218 | 715 |
| = 95 | Maike Business Center Tower 1 | Xi An, China | 50 | 218 | 715 |
| 97 | Evolution Tower | Panama City, Panama | 54 | 218 | 715 |
| 98 | Shenyang New World Center Tower E | Shenyang, China | 55 | 218 | 714 |
| = 99 | Genyuan Marriott Hotel | Yinchuan, China | 50 | 216 | 709 |
| = 99 | Mistral Office Tower | Izmir, Turkey | 48 | 216 | 709 |
| 101 | Chancheng Greenland Center Phase 2 Office Tower 1 | Foshan, China | 48 | 214 | 702 |
| 102 | Lodha Venezia Tower A | Mumbai, India | 68 | 214 | 700 |
| = 103 | The Sentral Residences Tower A | Kuala Lumpur, Malaysia | 58 | 210 | 690 |
| = 103 | The Sentral Residences Tower B | Kuala Lumpur, Malaysia | 58 | 210 | 690 |
| = 105 | Greenland Center Tower 8 | Nanning, China | 47 | 210 | 689 |
| = 105 | Fortune Center Residential Tower 2 | Liuzhou, China | 60 | 210 | 689 |
| = 105 | Fortune Financial Centre | Chongqing, China | 45 | 210 | 689 |
| = 105 | SINIC Center | Nanchang, China | 35 | 210 | 689 |
| = 105 | Ryomyong Street 55-Storey Building | Pyongyang, North Korea | 55 | 210 | 689 |
| 110 | FWD Tower | Jakarta, Indonesia | 40 | 209 | 687 |
| 111 | The Beekman Hotel & Residences | New York City, United States | 47 | 209 | 687 |
| 112 | Horizon Skyline Garden Office Tower | Shenzhen, China | 44 | 209 | 686 |
| 113 | The Parkhouse Nishi Shinjuku Tower 60 | Tokyo, Japan | 60 | 209 | 686 |
| = 114 | Huijing Center Tower 1 | Dongguan, China | 52 | 208 | 682 |
| = 114 | Sunshine International Tower | Lianyungang, China | 60 | 208 | 682 |
| = 114 | CECIC Headquarters | Nanchang, China | | 208 | 682 |
| 117 | Rosewood Sanya and International Finance Forum | Sanya, China | 46 | 207 | 680 |
| 118 | Wynn International Financial Center | Xi An, China | 46 | 206 | 675 |
| 119 | Akasaka Intercity AIR | Tokyo, Japan | 37 | 205 | 673 |
| = 120 | Al Rajhi Bank Tower | Riyadh, Saudi Arabia | 36 | 205 | 673 |
| = 120 | Eternity Apartment @ District 8 | Jakarta, Indonesia | 51 | 205 | 673 |
| = 120 | Infinity Apartment @ District 8 | Jakarta, Indonesia | 51 | 205 | 673 |
| = 120 | Horizon Tower A | Abu Dhabi, United Arab Emirates | 63 | 205 | 673 |
| = 120 | Harmony Square | Nantong, China | 47 | 205 | 673 |
| 125 | 88 Scott | Toronto, Canada | 58 | 204 | 669 |
| 126 | Baoji IFC | Baoji, China | 41 | 203 | 667 |
| = 127 | Triumph One #1 | Nanning, China | 47 | 203 | 666 |
| = 127 | Triumph One #2 | Nanning, China | 47 | 203 | 666 |
| = 129 | EQ Tower | Melbourne, Australia | 63 | 202 | 663 |
| = 129 | Hotel Estelar Bocagrande | Cartagena, Colombia | 52 | 202 | 663 |
| 131 | The Shahar Tower | Givatayim, Israel | 52 | 202 | 661 |
| 132 | F5 Tower | Seattle, United States | 43 | 201 | 660 |
| = 133 | Triumph One #3 | Nanning, China | 46 | 200 | 657 |
| = 133 | Triumph One #4 | Nanning, China | 46 | 200 | 657 |
| 135 | Britam Tower | Nairobi, Kenya | 31 | 200 | 656 |
| = 136 | Three Central | Makati, Philippines | 51 | 200 | 656 |
| = 136 | Chengdu World Financial Center 1 | Chengdu, China | 46 | 200 | 656 |
| = 136 | Chengdu World Financial Center 2 | Chengdu, China | 46 | 200 | 656 |
| = 136 | Nanjing Financial City Tower 4 | Nanjing, China | 46 | 200 | 656 |
| = 136 | Seoul Trimage Tower I | Seoul, South Korea | 47 | 200 | 656 |
| = 136 | Seoul Trimage Tower II | Seoul, South Korea | 47 | 200 | 656 |
| = 136 | Ryomyong Street 50-Storey Building | Pyongyang, North Korea | 50 | 200 | 656 |
| = 136 | Al-Obeikan Hilton Tower Hotel | Riyadh, Saudi Arabia | 35 | 200 | 656 |
| = 136 | Victoria Mansion Tower 1 | Dalian, China | 57 | 200 | 656 |
Top 30 Projected 2018 Completions
| Rank | Building Name | City | Stories | m | ft |
|---|
| 1 | Goldin Finance 117 | Tianjin, China | 128 | 597 | 1957 |
| 2 | China Zun Tower | Beijing, China | 108 | 528 | 1732 |
| 3 | Lakhta Center | St. Petersburg, Russia | 86 | 462 | 1516 |
| 4 | Changsha IFS Tower T1 | Changsha, China | 94 | 452 | 1483 |
| 5 | Suzhou IFS | Suzhou, China | 98 | 450 | 1476 |
| 6 | Wuhan Center Tower | Wuhan, China | 88 | 438 | 1437 |
| 7 | China Resources Headquarters | Shenzhen, China | 67 | 393 | 1288 |
| 8 | Capital Market Authority Tower | Riyadh, Saudi Arabia | 76 | 385 | 1263 |
| 9 | Nanning Logan Century 1 | Nanning, China | 82 | 381 | 1251 |
| 10 | Hanking Center Tower | Shenzhen, China | 73 | 350 | 1148 |
| 11 | Xiamen Cross Strait Financial Centre | Xiamen, China | 68 | 344 | 1128 |
| 12 | Four Seasons Place | Kuala Lumpur, Malaysia | 65 | 343 | 1124 |
| 13 | Comcast Technology Center | Philadelphia, United States | 59 | 342 | 1121 |
| 14 | One Shenzhen Bay Tower 7 | Shenzhen, China | 71 | 341 | 1120 |
| 15 | Suning Plaza Tower 1 | Zhenjiang, China | 77 | 341 | 1120 |
| 16 | DAMAC Heights | Dubai, United Arab Emirates | 88 | 335 | 1100 |
| = 17 | Twin Towers Guiyang, East Tower | Guiyang, China | 74 | 335 | 1099 |
| = 17 | Twin Towers Guiyang, West Tower | Guiyang, China | 74 | 335 | 1099 |
| 19 | 3 World Trade Center | New York City, United States | 69 | 329 | 1079 |
| 20 | Baoneng Center | Shenzhen, China | 65 | 327 | 1074 |
| 21 | Salesforce Tower | San Francisco, United States | 61 | 326 | 1070 |
| = 22 | Changsha IFS Tower T2 | Changsha, China | 63 | 315 | 1033 |
| = 22 | Magnolias Waterfront Residences Tower 1 | Bangkok, Thailand | 70 | 315 | 1033 |
| 24 | Guangfa Securities Headquarters | Guangzhou, China | 62 | 308 | 1010 |
| 25 | KAFD World Trade Center | Riyadh, Saudi Arabia | 67 | 304 | 997 |
| = 26 | NBK Tower | Kuwait City, Kuwait | 59 | 300 | 984 |
| = 26 | Shenglong Global Center | Fuzhou, China | 57 | 300 | 984 |
| = 26 | Al Habtoor City Tower 1 | Dubai, United Arab Emirates | 74 | 300 | 984 |
| = 26 | Al Habtoor City Tower 2 | Dubai, United Arab Emirates | 74 | 300 | 984 |
| 30 | Four Seasons Hotel and Private Residences and Capella Hotel | Bangkok, Thailand | 73 | 300 | 983 |