Completions by Country
Note: Only countries with at least two completions in 2016 are included in this chart. One tall building 200 m+ in height was also completed during 2016 in these countries: Azerbaijan, Bahrain, Japan, Kuwait, Mexico, Poland, Russia and Saudi Arabia.
For the ninth year running, China had the most 200-meter-plus completions with 84, representing 67% of the global 2016 total, and marking a 24% increase over its previous record of 68 in 2015.
The United States took second place with seven completions, and South Korea followed closely with six. Meanwhile, Indonesia came in fourth with five completions and the Philippines and Qatar trailed with four.
Completions by City
Note: Two or fewer tall buildings 200 m+ in height were also completed during 2016 in these cities: Abu Dhabi; Baku; Bangkok; Beijing; Boston; Dubai; Changsha; Foshan; Fuzhou; Guiyang; Hangzhou; Jersey City; Jinan; Kuala Lumpur; Kunshan; Kuwait City; Liuzhou; Makati; Manama; Melbourne; Mexico City; Moscow; Nagoya; Nanning; Ningbo; Qingdao; Riyadh; Shanghai; Singapore; Suzhou; Sydney; Taguig City; Warsaw; Wenzhou; Xiamen; Xi’an; Yiwu; Zhengzhou
Shenzhen had the highest number of 200-meter-plus completions of any city in 2016 with 11 (more than any country other than China managed to complete), while China’s Chongqing and Guangzhou, and Goyang, South Korea tied for second place with six each. The total height of buildings completed in Shenzhen is 2,608 meters.
Completions Timeline
The 128 buildings completed in 2016 beat every previous year on record, including the previous record high of 114 completions in 2015. This brings the total number of 200-meter-plus buildings in the world to 1,168, marking a 441% increase from the year 2000, when only 265 existed.
A total of 10 supertalls (buildings of 300 meters or higher) were completed in 2016, fewer than we anticipated this time last year, partly as a result of construction delays typical of buildings in this height range. Nonetheless, 2016 still saw the third-largest number of supertall completions of any year, falling only behind 2015, which saw 14; and 2014, which saw 11.
We currently project the completion of between 125 and 150 buildings of 200 meters' height or greater. Perhaps even more staggering is the fact that 12 to 20 of these buildings are expected to be in the supertall range.
Completions by Location
{
Asia retained its status as the world’s skyscraper epicenter in 2016, completing 107 buildings, representing 84% of the 128-building total.
The Middle East matched its 2015 numbers with nine completions in 2016, with North America experiencing a slight increase this year, up from four completions in 2015 to seven in 2016.
North America had a big year with seven completions, Australia and Europe make notable appearances on the list with two.
Completions by Function
Interestingly, the functional split for tall building completions in 2016 remains almost perfectly consistent with that of previous years. Office functions have by far the highest share, representing 52% of completions with 67, achieving a consecutive all-time record over 2015, in which there were 53. Meanwhile, 38 mixed-use buildings were completed, representing 30% of the total; while 20 residential buildings came online with a share of 16%. Only three all-hotel towers were completed in 2016, representing just 3% of the total. Given that hotel functions are critical components of many mixed-use developments, the low number of completions for hotel-only towers does not indicate a downward trend for the function altogether.
Completions by Material
The number of buildings completed in 2016 with composite structural systems hit an all-time high this year, with 68, or 53% of the total. Composite construction represents an effort to use the optimal properties of steel and concrete and counteract their respective weaknesses. Thus, this material trend is expected to continue to dominate, particularly as tall buildings continue to proliferate in seismically active regions like China, which mandate robust structural responses. Concrete construction took the remaining share of completions with 58, or 45% of the total. The significant use of concrete can be attributed to a combination of concrete’s relative ubiquity and lower cost in many regions, as well as its comparative simplicity in construction, which would increase its appeal in regions with lower-skilled labor pools. In 2016, not a single building of 200 meters or higher was completed with an all-steel structural system. The use of steel in tall buildings has almost completely transitioned into composite construction. As of this writing, there are only nineteen 200-meter-plus buildings currently under construction that employ all-steel structural systems.
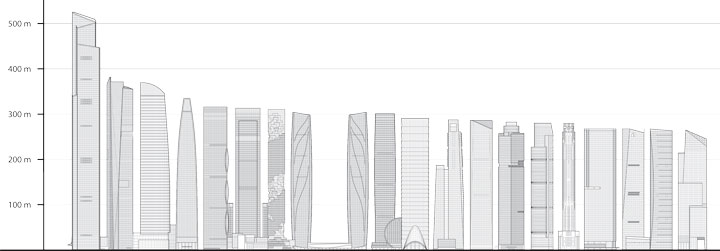
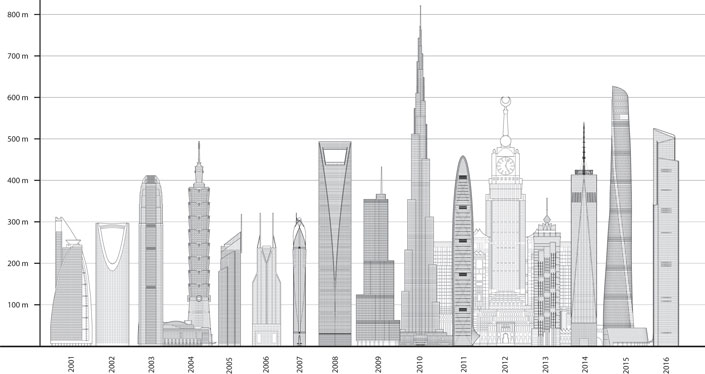
Skyline: Tallest Building by Year
Guangzhou CTF Finance Centre, Guangzhou, at 530 meters, was the tallest building to complete in 2016, and is now the tallest building in Guangzhou, the second tallest in China, and the fifth tallest in the world.
Average Building Height
Although the average height of all 200m+ completions seems to fluctuate each year, the average height of the tallest 100 buildings continues to rise as the industry pushes itself further into the sky.
World's 100 Tallest by Location
World's 100 Tallest by Function
Mixed-use functions continue to enjoy a plurality in the 100 Tallest list, with 41 buildings, the same count as in 2015. Meanwhile, office functions take a slightly greater share in 2016 with 40 buildings, up from 38 in 2015. Residential and hotel functions have smaller shares, with 12 and seven buildings, respectively.
World's 100 Tallest by Material
The 100 Tallest list continues to be dominated by composite construction, with 53 buildings now employing composite systems, up from 46 in 2015. All-concrete and steel primary structures have experienced slight losses, down to 34 buildings for concrete and nine for steel.
List of 2016 Completions
| Rank | Building Name | City | Stories | m | ft |
|---|
| 1 |
Guangzhou CTF Finance Centre |
Guangzhou, China |
111 |
530 |
1,739 |
| 2 |
Eton Place Dalian Tower 1 |
Dalian, China |
80 |
383 |
1,257 |
| 3 |
Federation Towers - Vostok Tower |
Moscow, Russia |
95 |
374 |
1,226 |
| 4 |
Tianjin Modern City Office Tower |
Tianjin, China |
65 |
338 |
1,109 |
| 5 |
Global City Square |
Guangzhou, China |
67 |
319 |
1,046 |
| 6 |
Chongqing IFS T1 |
Chongqing, China |
62 |
316 |
1,037 |
| 7 |
MahaNakhon |
Bangkok, Thailand |
75 |
314 |
1,031 |
| = 8 |
Wanda Plaza 1 |
Kunming, China |
67 |
307 |
1,008 |
| = 8 |
Wanda Plaza 2 |
Kunming, China |
67 |
307 |
1,008 |
| 10 |
Shenzhen CFC Changfu Centre |
Shenzhen, China |
68 |
304 |
997 |
| 11 |
Riverfront Times Square |
Shenzhen, China |
64 |
293 |
961 |
| 12 |
Tanjong Pagar Centre |
Singapore, Singapore |
68 |
290 |
951 |
| 13 |
China Chuneng Tower |
Shenzhen, China |
62 |
289 |
947 |
| 14 |
Gama Tower |
Jakarta, Indonesia |
64 |
286 |
937 |
| 15 |
GT Land Landmark Plaza South Tower |
Guangzhou, China |
47 |
283 |
928 |
| 16 |
30 Park Place |
New York City, USA |
67 |
282 |
926 |
| = 17 |
Tianhui Plaza C3 |
Guangzhou, China |
60 |
270 |
886 |
| = 17 |
Greenland Center Tower 1 |
Xi'an, China |
57 |
270 |
886 |
| 19 |
Huayuan Center Tower 7 |
Changsha, China |
54 |
270 |
885 |
| 20 |
10 Hudson Yards |
New York City, USA |
52 |
268 |
878 |
| 21 |
Hongren Fortune Center |
Wuhan, China |
47 |
265 |
868 |
| 22 |
Financial Street Heping Center |
Tianjin, China |
47 |
263 |
863 |
| = 23 |
Oriental Plaza T1 |
Chongqing, China |
56 |
262 |
860 |
| = 23 |
Xinglin Bay Business Tower |
Xiamen, China |
54 |
262 |
860 |
| 25 |
Beijing Greenland Dawangjing Tower |
Beijing, China |
55 |
260 |
853 |
| 26 |
Grand Hyatt Metrocenter |
Taguig City, Philippines |
66 |
258 |
848 |
| = 27 |
Wenzhou Zhixin Plaza |
Wenzhou, China |
53 |
255 |
837 |
| = 27 |
Regent Emirates Pearl |
Abu Dhabi, UAE |
52 |
255 |
837 |
| 29 |
Wongtee Plaza |
Shenzhen, China |
65 |
254 |
832 |
| 30 |
R&F International Business Center Phase 2 |
Guangzhou, China |
53 |
253 |
829 |
| 31 |
Golden Eagle Plaza |
Kunshan, China |
55 |
252 |
827 |
| 32 |
56 Leonard Street |
New York City, USA |
57 |
250 |
821 |
| = 33 |
HKRI Centre One |
Shanghai, China |
51 |
250 |
820 |
| = 33 |
Fusheng Qianlong Plaza |
Fuzhou, China |
50 |
250 |
820 |
| 35 |
Yunda Central Plaza - St. Regis Hotel |
Changsha, China |
63 |
249 |
816 |
| 36 |
Poly Business Center Office Tower |
Foshan, China |
55 |
248 |
814 |
| = 37 |
Torre Reforma |
Mexico City, Mexico |
56 |
246 |
807 |
| = 37 |
Shangbang Leasing Tower |
Tianjin, China |
54 |
246 |
807 |
| = 37 |
Ningbo Bank of China Headquarters |
Ningbo, China |
51 |
246 |
807 |
| 40 |
Waldorf Astoria + Magnolias Ratchaprasong |
Bangkok, Thailand |
60 |
242 |
794 |
| = 41 |
Banyan Tree Signatures |
Kuala Lumpur, Malaysia |
55 |
240 |
787 |
| = 41 |
Central Bank of Kuwait |
Kuwait City, Kuwait |
42 |
240 |
787 |
| 43 |
Xi`an Center |
Xi'an, China |
54 |
238 |
781 |
| 44 |
Excellence Century Center Tower 1 |
Qingdao, China |
57 |
237 |
779 |
| 45 |
ASE Center R3 |
Chongqing, China |
69 |
237 |
777 |
| = 46 |
Ilsan Yojin Y-City Tower 103 |
Goyang, South Korea |
59 |
230 |
755 |
| = 46 |
Ilsan Yojin Y-City Tower 105 |
Goyang, South Korea |
59 |
230 |
755 |
| = 46 |
Hilton Double Tree Sinyar Tower |
Doha, Qatar |
53 |
230 |
755 |
| = 46 |
International Fortune Plaza Tower A |
Suzhou, China |
44 |
230 |
755 |
| 50 |
Shangri-La at the Fort |
Taguig City, Philippines |
63 |
229 |
752 |
| 51 |
North Yoker Plaza Tower A |
Shenyang, China |
45 |
229 |
751 |
| = 52 |
Dalian Dingsen Center North Tower |
Dalian, China |
52 |
228 |
748 |
| = 52 |
Dalian Dingsen Center South Tower |
Dalian, China |
52 |
228 |
748 |
| = 52 |
Changchenghui Tower 1 |
Wuhan, China |
43 |
228 |
748 |
| 55 |
Kingold Century |
Guangzhou, China |
46 |
227 |
745 |
| = 56 |
Ilsan Yojin Y-City Tower 102 |
Goyang, South Korea |
58 |
225 |
738 |
| = 56 |
Ilsan Yojin Y-City Tower 104 |
Goyang, South Korea |
58 |
225 |
738 |
| = 56 |
Yunzhong Tower 1 |
Nanchang, China |
51 |
225 |
738 |
| = 56 |
Yunzhong Tower 2 |
Nanchang, China |
51 |
225 |
738 |
| 60 |
China Resources Building |
Chongqing, China |
44 |
224 |
734 |
| = 61 |
Vision Apartments |
Melbourne, Australia |
69 |
223 |
732 |
| = 61 |
BTPN Office Tower |
Jakarta, Indonesia |
48 |
223 |
732 |
| 63 |
Qatar Petroleum District Tower 7 |
Doha, Qatar |
47 |
223 |
731 |
| 64 |
Kerry Center |
Nanchang, China |
45 |
222 |
728 |
| 65 |
Ilsan Yojin Y-City Tower 106 |
Goyang, South Korea |
57 |
221 |
725 |
| = 66 |
Park Lane Manor 5 |
Nanning, China |
60 |
220 |
722 |
| = 66 |
Park Lane Manor 6 |
Nanning, China |
60 |
220 |
722 |
| = 66 |
Alphaland Makati Place |
Makati, Philippines |
55 |
220 |
722 |
| = 66 |
Warsaw Spire |
Warsaw, Poland |
49 |
220 |
722 |
| = 66 |
Wyndham Centre |
Chongqing, China |
48 |
220 |
722 |
| = 66 |
Shuiwan 1979 Tower |
Shenzhen, China |
47 |
220 |
722 |
| = 66 |
Golden Eagle International Shopping Center |
Nanjing, China |
42 |
220 |
722 |
| = 73 |
Oriental Hope Intertek Plaza 1 |
Chengdu, China |
45 |
219 |
719 |
| = 73 |
Oriental Hope Intertek Plaza 2 |
Chengdu, China |
45 |
219 |
719 |
| = 73 |
Sino Life Insurance Building |
Shenzhen, China |
0 |
219 |
719 |
| = 76 |
China Resources Center 1 |
Hefei, China |
43 |
218 |
716 |
| = 77 |
252 East 57th Street |
New York City, USA |
65 |
218 |
715 |
| = 77 |
Causeway Bay International Plaza |
Nanchang, China |
42 |
218 |
715 |
| = 77 |
Chongqing Rural Commercial Bank Financial Building |
Chongqing, China |
42 |
218 |
715 |
| = 77 |
Zhejiang Television Center |
Hangzhou, China |
42 |
218 |
715 |
| 81 |
International Towers Tower 1 |
Sydney, Australia |
51 |
217 |
712 |
| = 82 |
Capital Place Office Tower |
Jakarta, Indonesia |
47 |
215 |
706 |
| = 83 |
Jinshi International Plaza 1 |
Qingdao, China |
54 |
215 |
705 |
| = 83 |
World Trade Center 1 |
Yiwu, China |
0 |
215 |
705 |
| 85 |
Four Seasons Tower |
Tianjin, China |
48 |
215 |
704 |
| 86 |
Ilsan Yojin Y-City Tower 101 |
Goyang, South Korea |
55 |
214 |
702 |
| 87 |
URL |
Jersey City, USA |
70 |
213 |
700 |
| 88 |
International Financial Centre Tower 2 |
Jakarta, Indonesia |
49 |
213 |
699 |
| 89 |
The 118 Tower |
Dubai, UAE |
46 |
212 |
696 |
| 90 |
The Tower |
Jakarta, Indonesia |
50 |
212 |
695 |
| 91 |
JR Gate Tower |
Nagoya, Japan |
46 |
211 |
693 |
| 92 |
No. 1 Shanghai |
Shanghai, China |
34 |
210 |
691 |
| = 93 |
Fortune Center Residential Tower 1 |
Liuzhou, China |
60 |
210 |
689 |
| = 93 |
Park Terraces Point Tower |
Makati, Philippines |
59 |
210 |
689 |
| = 93 |
Asia-Pacific Center |
Guiyang, China |
55 |
210 |
689 |
| = 93 |
Harmonious Century Tower A |
Kunming, China |
55 |
210 |
689 |
| = 93 |
Harmonious Century Tower B |
Kunming, China |
55 |
210 |
689 |
| = 93 |
The Crescent City |
Baku, Azerbaijan |
52 |
210 |
689 |
| = 93 |
Ahcof City Plaza |
Hefei, China |
51 |
210 |
689 |
| = 93 |
New City International |
Hefei, China |
47 |
210 |
689 |
| = 93 |
CNOOC New Tower 1 |
Shenzhen, China |
45 |
210 |
689 |
| = 93 |
CNOOC New Tower 2 |
Shenzhen, China |
45 |
210 |
689 |
| 103 |
The Beekman Hotel & Residences |
New York City, USA |
47 |
209 |
687 |
| 104 |
China Co-op Group Tower |
Dalian, China |
41 |
209 |
686 |
| 105 |
King of Towers |
Dalian, China |
41 |
208 |
682 |
| = 106 |
Millennium Tower |
Boston, USA |
54 |
208 |
681 |
| = 106 |
Wenbo Tower |
Shenzhen, China |
48 |
208 |
682 |
| 108 |
Oasia Hotel Downtown |
Singapore, Singapore |
27 |
207 |
678 |
| 109 |
St. Regis Hotel & Residences |
Kuala Lumpur, Malaysia |
48 |
205 |
673 |
| = 110 |
Chengdu Fantasia Meinian Plaza, Tower C |
Chengdu, China |
48 |
204 |
670 |
| = 110 |
Chengdu Fantasia Meinian Plaza, Tower D |
Chengdu, China |
48 |
204 |
670 |
| 112 |
Dongyuan International Chengdu Sichuan Airlines Square |
Chengdu, China |
47 |
204 |
669 |
| 113 |
Eton Shenyang Center #5 |
Shenyang, China |
60 |
203 |
665 |
| 114 |
Shenzhen Venture Capital |
Shenzhen, China |
44 |
202 |
664 |
| = 115 |
Jinan Center Financial City A3-5 |
Jinan, China |
44 |
202 |
663 |
| = 115 |
Huijin International Plaza |
Guiyang, China |
40 |
202 |
663 |
| 117 |
Hongyun Building Tower A |
Shenyang, China |
44 |
201 |
660 |
| = 118 |
Gateway Towers AQ-1 |
Doha, Qatar |
43 |
201 |
659 |
| = 118 |
Gateway Towers AQ-2 |
Doha, Qatar |
43 |
201 |
659 |
| = 120 |
United Tower |
Manama, Bahrain |
47 |
200 |
656 |
| = 120 |
China Oceanwide International Center Tower 1 |
Wuhan, China |
46 |
200 |
656 |
| = 120 |
Nanjing Financial City Tower 2 |
Nanjing, China |
46 |
200 |
656 |
| = 120 |
Nanjing Financial City Tower 6 |
Nanjing, China |
46 |
200 |
656 |
| = 120 |
Mincheng Center Hotel |
Fuzhou, China |
45 |
200 |
656 |
| = 120 |
Centralcon Group Tower |
Shenzhen, China |
43 |
200 |
656 |
| = 120 |
Jinshui Wanda Center Office Tower |
Zhengzhou, China |
43 |
200 |
656 |
| = 120 |
Burj DAMAC |
Riyadh, Saudi Arabia |
36 |
200 |
656 |
| = 120 |
Suning Electric Plaza |
Nanjing, China |
0 |
200 |
656 |
Top 30 Projected 2017 Completions
| Rank | Building Name | City | Stories | m | ft |
|---|
| 1 |
Ping An Finance Center |
Shenzhen, China |
115 |
599 |
1,965 |
| 2 |
Lotte World Tower |
Seoul, South Korea |
123 |
555 |
1,819 |
| 3 |
Changsha IFS Tower T1 |
Changsha, China |
94 |
452 |
1,483 |
| 4 |
Suzhou IFS |
Suzhou, China |
98 |
450 |
1,476 |
| 5 |
Wuhan Center Tower |
Wuhan, China |
88 |
438 |
1,437 |
| 6 |
Marina 101 |
Dubai, UAE |
101 |
427 |
1,399 |
| 7 |
Capital Market Authority Tower |
Riyadh, Saudi Arabia |
76 |
385 |
1,263 |
| 8 |
Nanning Logan Century 1 |
Nanning, China |
82 |
383 |
1,257 |
| 9 |
Dalian International Trade Center |
Dalian, China |
86 |
370 |
1,214 |
| 10 |
The Address The BLVD |
Dubai, UAE |
72 |
368 |
1,207 |
| 11 |
Xiamen Cross Strait Financial Centre |
Xiamen, China |
68 |
344 |
1,128 |
| 12 |
Ahmed Abdul Rahim Al Attar Tower |
Dubai, UAE |
76 |
342 |
1,122 |
| 13 |
Suning Plaza Tower 1 |
Zhenjiang, China |
77 |
341 |
1,120 |
| 14 |
DAMAC Heights |
Dubai, UAE |
88 |
335 |
1,100 |
| = 15 |
Twin Towers Guiyang, West Tower |
Guiyang, China |
74 |
335 |
1,099 |
| = 15 |
Twin Towers Guiyang, East Tower |
Guiyang, China |
74 |
335 |
1,099 |
| 17 |
Wilshire Grand Center |
Los Angeles, USA |
73 |
335 |
1,099 |
| 18 |
Zhuhai St. Regis Hotel & Office Tower |
Zhuhai, China |
67 |
330 |
1,083 |
| 19 |
Yuexiu Fortune Center Tower 1 |
Wuhan, China |
65 |
330 |
1,083 |
| 20 |
Hon Kwok City Center |
Shenzhen, China |
80 |
329 |
1,081 |
| 21 |
Yantai Shimao No. 1 The Harbour |
Yantai, China |
59 |
323 |
1,060 |
| 22 |
Guangxi Finance Plaza |
Nanning, China |
68 |
321 |
1,053 |
| 23 |
Sinar Mas Center 1 |
Shanghai, China |
66 |
320 |
1,048 |
| 24 |
Jiuzhou International Tower |
Nanning, China |
71 |
318 |
1,043 |
| 25 |
China World Trade Center Phase 3B |
Beijing, China |
59 |
316 |
1,037 |
| 26 |
Changsha IFS Tower T2 |
Changsha, China |
63 |
315 |
1,033 |
| 27 |
Poly Pazhou C2 |
Guangzhou, China |
61 |
309 |
1,015 |
| 28 |
Guangfa Securities Headquarters |
Guangzhou, China |
62 |
308 |
1,010 |
| 29 |
KAFD World Trade Center |
Riyadh, Saudi Arabia |
67 |
304 |
997 |
| 30 |
Shang Xin International Plaza |
Chongqing, China |
65 |
301 |
989 |
Total # of 200m+ Buildings at the End of Each Decade
In 2016, 128 buildings of 200 meters’ height or greater were completed, setting a new record for annual tall building completions and marking the third consecutive record-breaking year. This brings the total number of 200-meter-plus buildings in the world to 1,168, marking a 441% increase from 2000.
Buildings Entering 100 Tallest
A total of 10 supertalls (buildings of 300 meters or higher) were completed in 2016, fewer than we anticipated this time last year, partly as a result of construction delays typical of buildings in this height range. Nonetheless, 2016 still saw the third-largest number of supertall completions of any year, falling only behind 2015, which saw 14; and 2014, which saw 11.
Skyline: Tallest 2016 Completions