CTBUH 2018 Year in Review
China Zun Completions by Country Total # of Supertall Buildings 76% of Completions in Asia Shenzhen completed 14 200m+ buildings BD Bacata Torre 1 Completions List 1478 200m+ 19 cities worldwide Unites states
CTBUH 2018 Year in Review
Completions Timeline 34 Completions Timeline 144 Completions Timeline 28 Completions Timeline 69 Completions Timeline 53
Landscape Numbers Teal
Completions Timeline Completions Timeline Completions Timeline Completions Timeline Completions Timeline
Chinese/中文
Down
Scroll down to see more

CTBUH Year in Review: Tall Trends of 2018

The Council on Tall Buildings and Urban Habitat (CTBUH) publishes a yearly study that examines all 200-meter-plus tall buildings that were completed that year. The charts and descriptions are interactive.


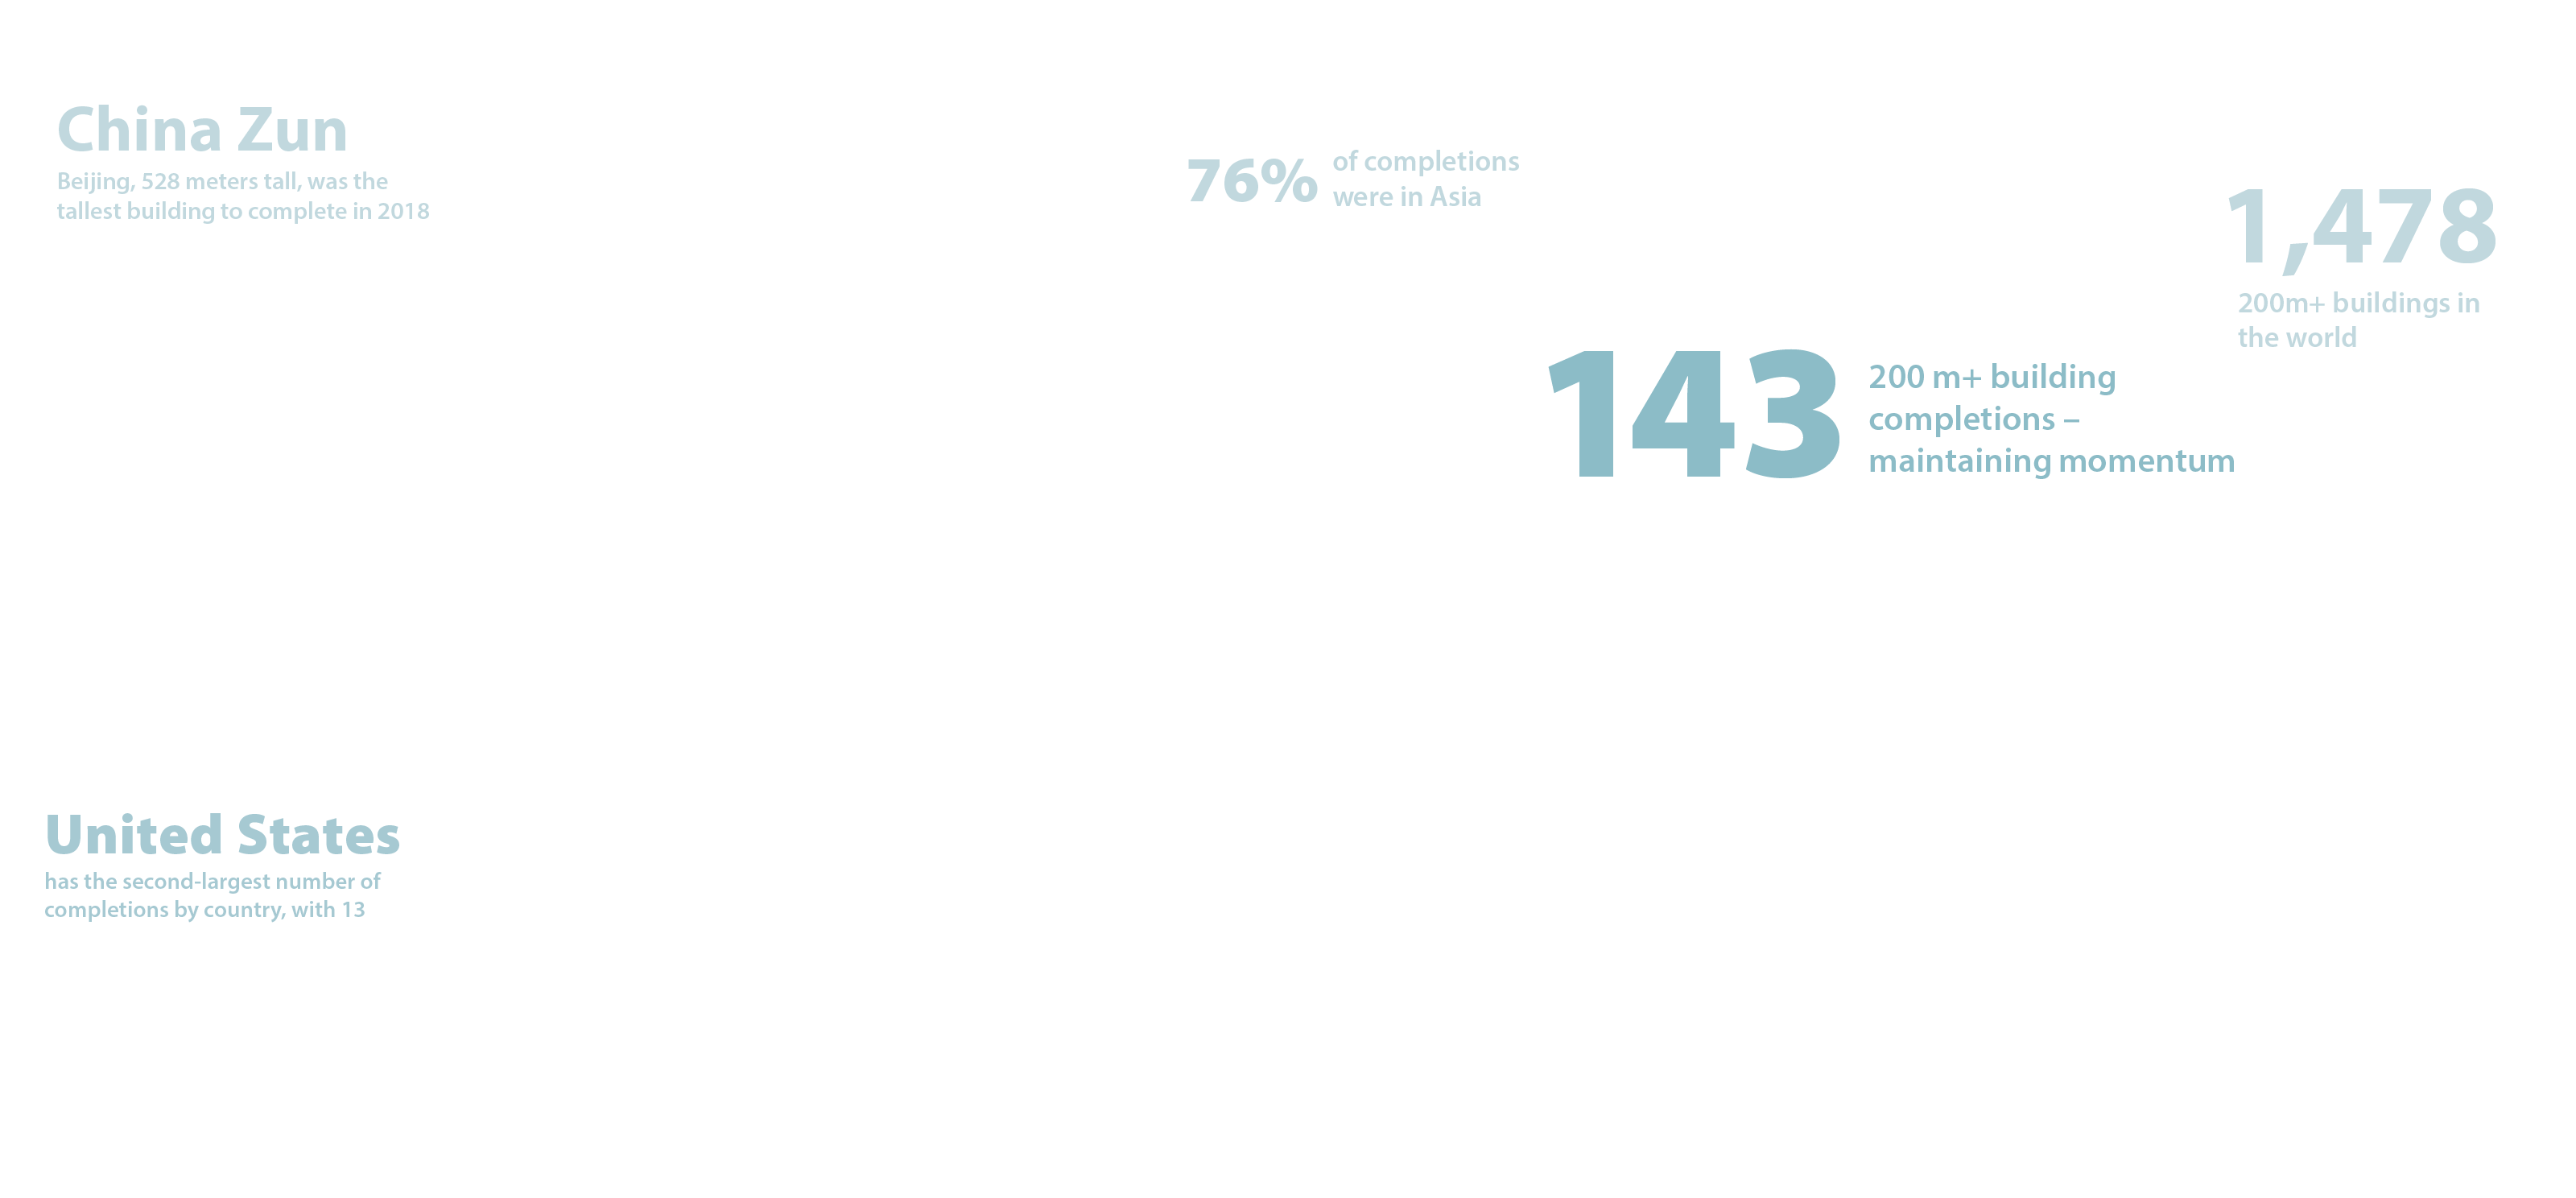
The astronomical growth in tall building construction observed over the past decade continued in 2018, though the total number of completed buildings of 200 meters’ or greater height 
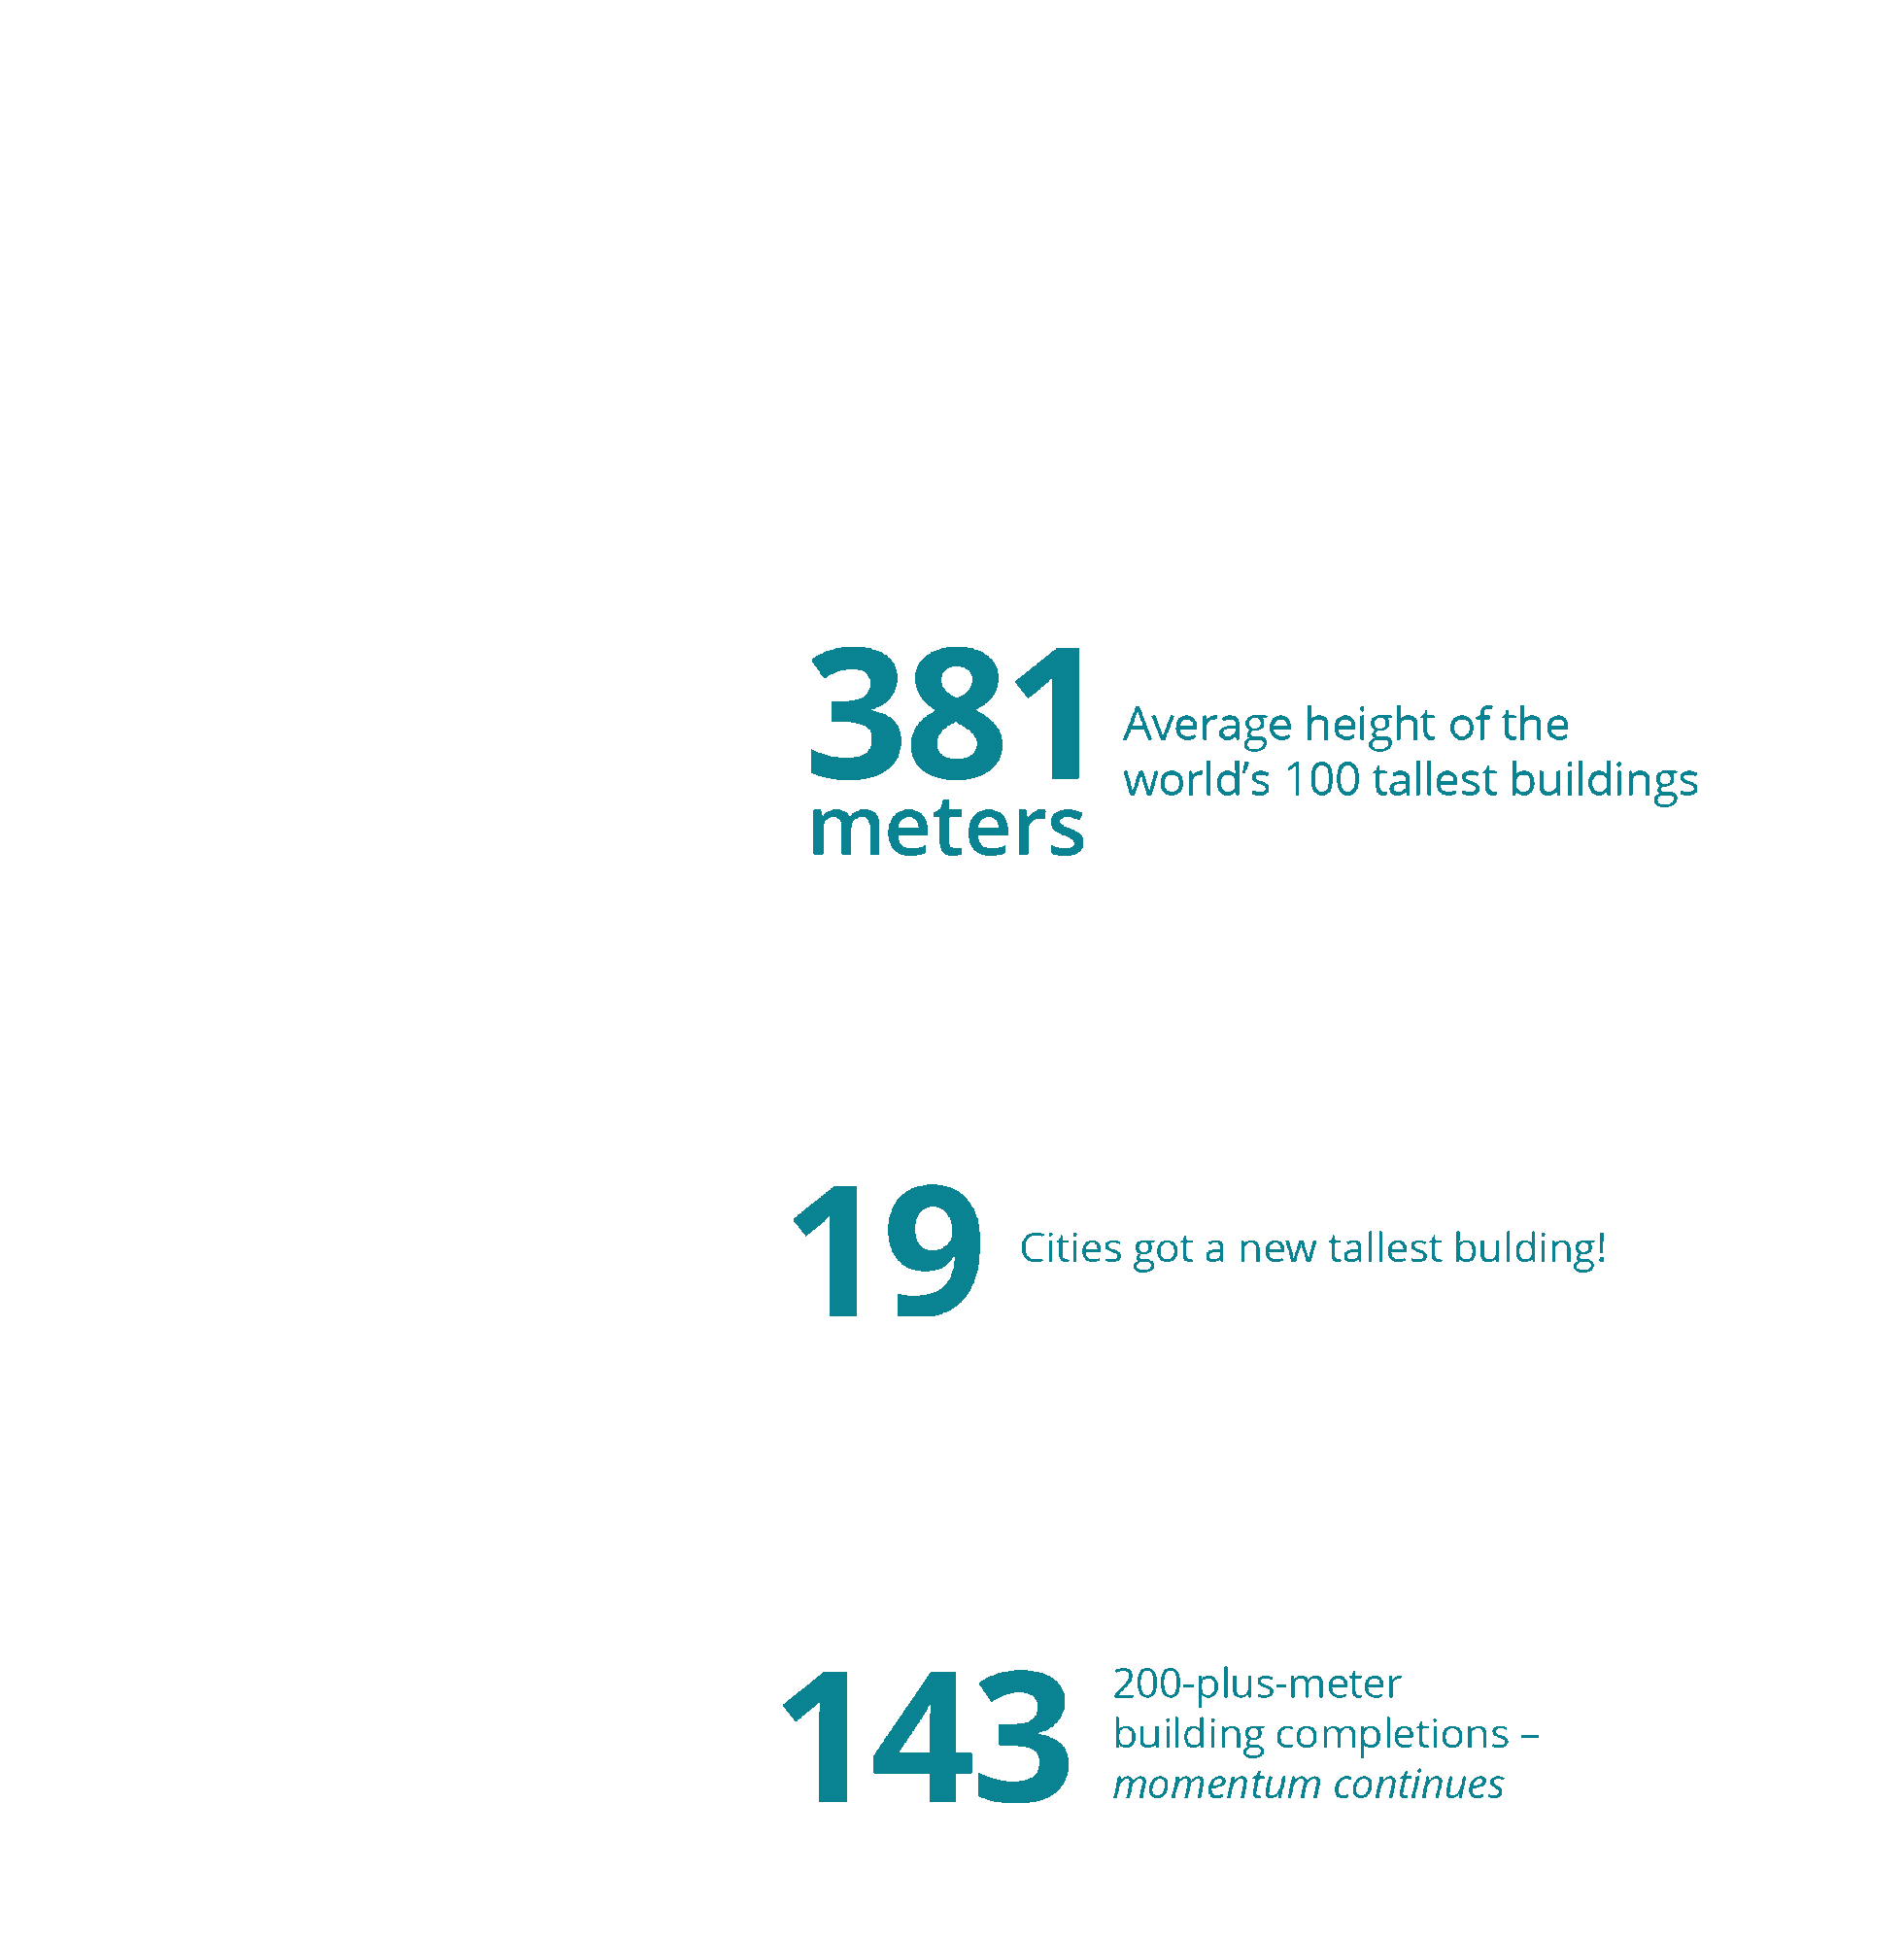
leveled off at 143, after hitting an all-time record of 147 in 2017. The total number of 200-meter-and-higher buildings in the world is now 1,478, a 141 percent increase from 614, 
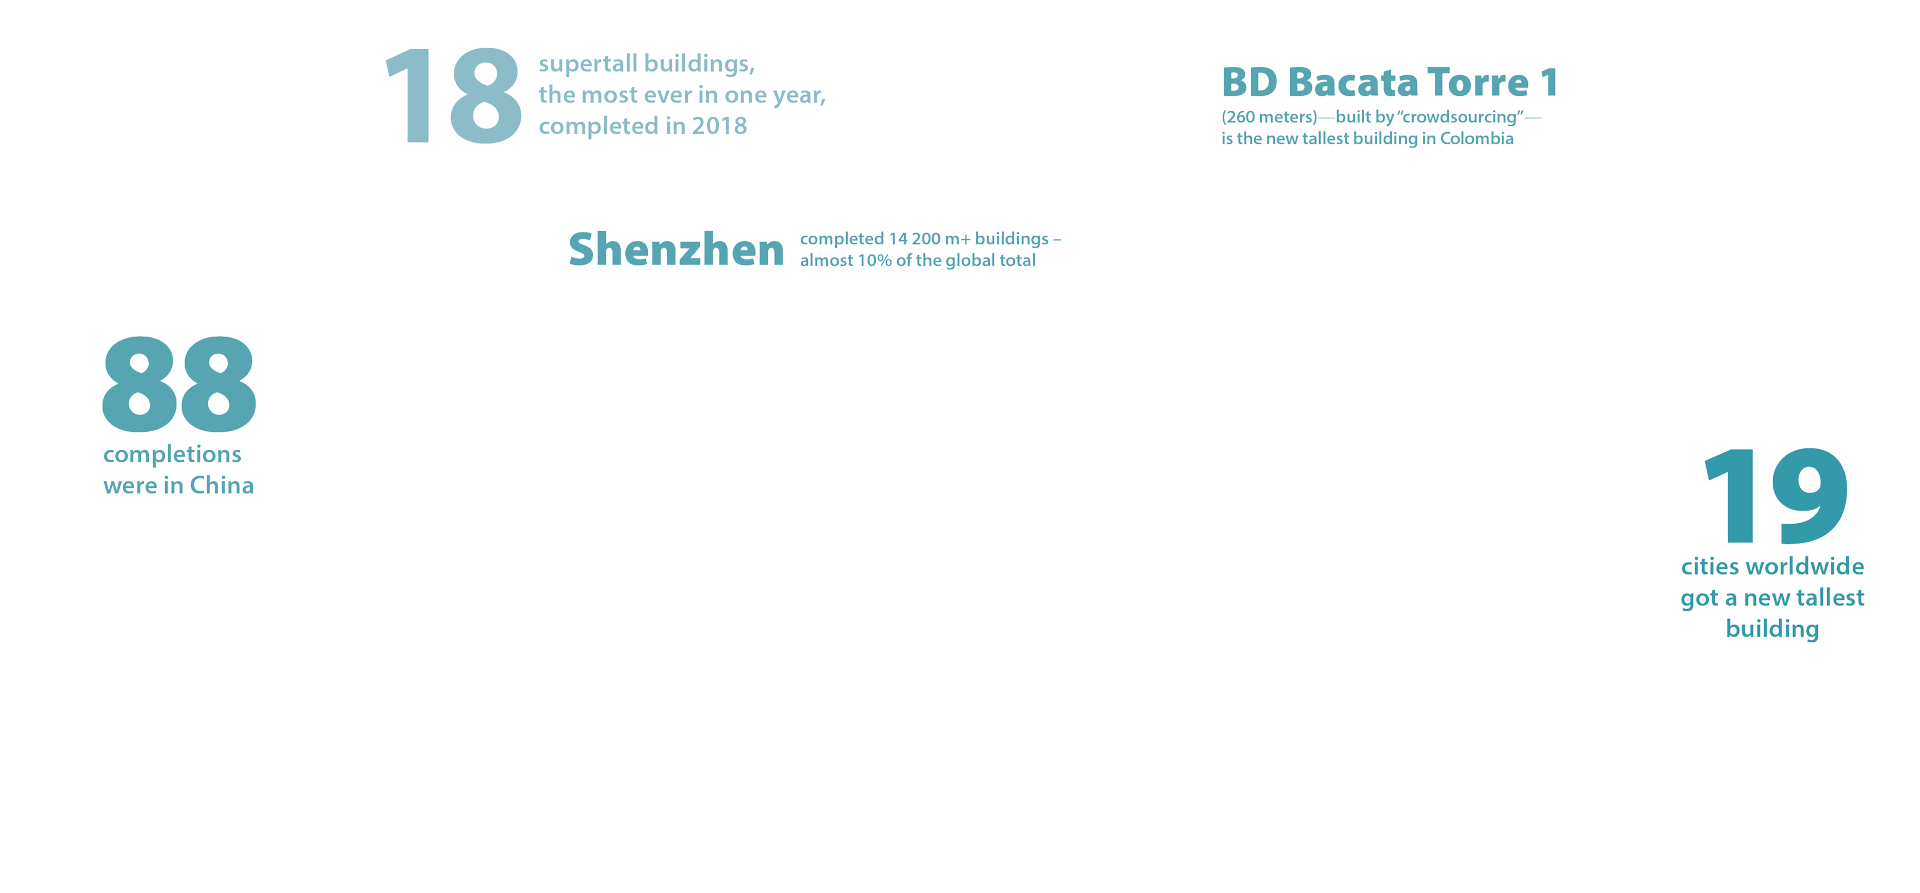
in 2010. The year recorded 18 “supertall” buildings of 300 meters or greater height, more than any year previously.

China has been a major driver of tall building completions in recent years. Click the button above to view the graph controlling for China and see the Completions by Country tab for more information.


Note: Only countries with at least two completions in 2018 are included in this chart. One 200 m+ tall building was also completed during 2018 in these countries: Argentina, Australia, Mexico, Philippines, Saudi Arabia, Singapore, Turkey, and Vietnam.

China has maintained its reign as the most prolific country when it comes to the construction of tall buildings, with 88 completions in 2018, for 61.5 percent of the total. This is a record for China, exceeds last year’s figure by eight, and represents an even greater proportion of the global total than the 2017 figure of 54.4 percent. China’s previous record was set in 2016, with 86 buildings of 200 meters or higher.

Second place was again held by the United States, with 13 completions, up from 10 in 2017. This was followed by the United Arab Emirates with 10, Indonesia with five, and Thailand tied with South Korea for sixth place, with three completions each.


Note: Two or fewer tall buildings 200 m+ in height were also completed during 2018 in these cities: Bogota, Buenos Aires, Chengdu, Chicago, Chongqing, Hangzhou, Ho Chi Minh City, Hong Kong, Istanbul, Jeddah, Jinan, Johor Bahru, Kunming, Kuwait City, Lanzhou, Luoyang, Melbourne, Mexico City, Miami, Nanchang, Philadelphia, Qingdao, Quezon City, Rizhao, San Francisco, Sanya, Singapore, Suzhou, Taipei, Toronto, Xiamen, Zhenjiang, and Zhuhai.

Once again, outdoing its own record from last year, Shenzhen, China, recorded 14 completions, making this the third year in a row in which the city completed the world’s largest number of 200-meter-plus buildings, and comprising nearly 10 percent of the global total. Dubai was in second place with 10 completions, followed by Beijing, New York City, and Shenyang in a tie for third place, with eight each.

With 109 buildings, representing 76 percent of the total, Asia remained at the top of the rankings in 2018, recording slightly fewer than its 2017 total of 113 buildings of at least 200 meters in height.

The Middle East performed better in 2018 than in the previous year, logging 13 completions, against nine for the region in 2017. This represents 9.1 percent of the global total.

North America rang in as a distant second place in the total number of 200-meter-plus building completions, with 16 in 2018, representing 11.2 percent of the global total. Nevertheless, this is a new record for the region, topping the prior record of 15 in 2017.

South America had an exciting 2018, with two buildings becoming the tallest in their respective cities and countries: The BD Bacata Torre 1 (260 meters) was completed in Bogota, Colombia; while the Alvear Tower Puerto Madero (235 meters) completed in Buenos Aires, Argentina.

Europe recorded the completion of only one building of 200 meters or greater, the Nurol Life building in Istanbul, Turkey, at 220 meters. This is a decline from 2017, when Europe recorded four completions.

Australia and Oceania: The South Pacific region also was relatively quiet in 2018, recording just one 200-meter-plus building completion, the Victoria One in Melbourne, Australia. This is a decline from two in 2017 (also both in Melbourne), and three in 2018.


The preponderance of office as the primary function in completed buildings 200 meters and higher continued in 2018, logging 60 buildings of 200 meters or greater height, down slightly from 61 buildings in 2017, and increasing the overall share to 42 percent from 41.5 percent. Residential functions declined to 45 buildings, or 31.5 percent, from 47 buildings and a 32 percent share in 2017. Mixed-use completions declined to 35 buildings, or 24.5 percent of the total, compared to 36 buildings and a 24.5 percent share in 2017. The only other function to see an increased number of completions, if only slightly, was hotel, which had three completions in 2018, against two in 2017.


The role of concrete as the primary structural material solidified further in 2018, comprising the structure of 90 out of 143 buildings 200 meters and higher, a 62.9 percent share. This is an increase from 74 (51 percent) in 2017. "Composite" structures, which use more than one material in spanning and supporting elements, constituted 50 (35 percent) of the buildings completed in 2018; a decrease in number and proportion from 2017, when the number was 64 (44.4 percent). "Mixed-use" structures, which employ distinct systems, one on top of the other, typically switching with a change of use, were in only two completions in 2018, representing 1.4 percent of the total. There was only one all-steel building of at least 200 meters completed in 2018, 181 Fremont in San Francisco, a 245-meter residential and office building.


The dominance of Asia as a region in terms of the proportion of the World’s 100 Tallest Buildings continued to grow in 2018, rising to 59 buildings, from 54 in 2017. The Middle East accounted for 23, a decrease from 26 in 2017, and from 24 in 2016. North America has 14 of the 100 tallest, down one from 15 in 2017. Europe’s figure dropped, to three, from four in 2017 and two in 2016. One of the Tallest 100 is in Oceania – the Q1 Tower in Australia’s Gold Coast (323 meters, rank number 85), which was completed in 2005.


<p>Mixed-use remained the dominant function in the 100 Tallest in 2018, reflecting 47 buildings, an increase of two from 2017. The figure for office functions was 38, down one from 2017. There were 10 buildings of at least 200 meters with an all-residential function completed in 2018, the same as in 2017; hotels represented five buildings in 2018, down from six in 2017. </p>


<p> Composite materials again constituted the majority of the primary structures of the World’s 100 Tallest Buildings, increasing the share to 57 buildings in 2018 from 52 in 2017. Concrete was the primary material in the structures of 30 buildings, a decrease from 33 in 2017. The number of all-steel buildings in the Tallest 100 dropped from 10 in 2017 to nine in 2018. Those buildings reported as being of “mixed” construction, in which distinctive sections of the buildings are predominantly steel or concrete, decreased to four in 2018, down from five in 2017. </p>

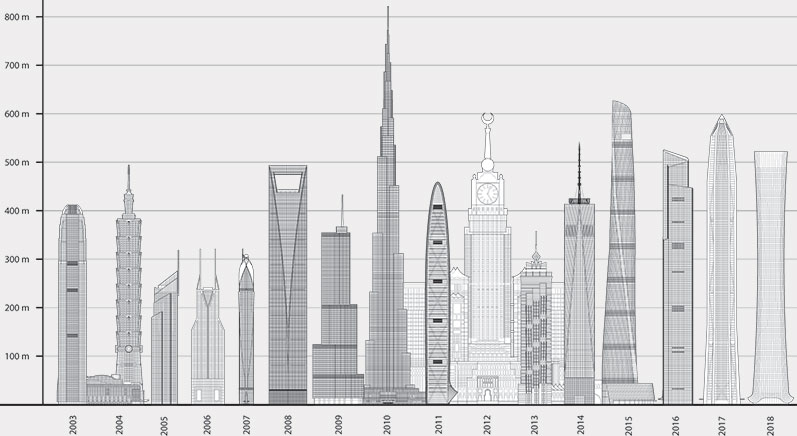
Skyline: Tallest Building by Year Tallest By Year 2018 Two International Finance Centre Taipei 101 Q1 Tower Shimao International Plaza Rose Rayhaan Shanghai Tower Trump International Hotel &amp; Tower Burj Khalifa KK100 Makkah Royal Clock Tower Hotel JW Marriott Marquis Hotel Dubai Tower 2 One World Trade Center Shanghai World Financial Center Guangzhou CTF Finance Centre Ping An Finance Center China Zun


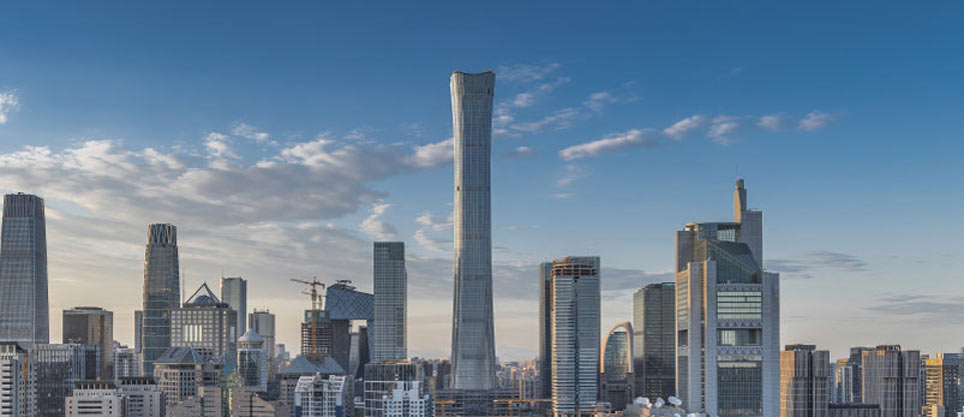
China Zun, Beijing, was the tallest building to complete in 2018, at 528 meters. It is now the fourth-tallest building in China and the eighth-tallest building in the world.

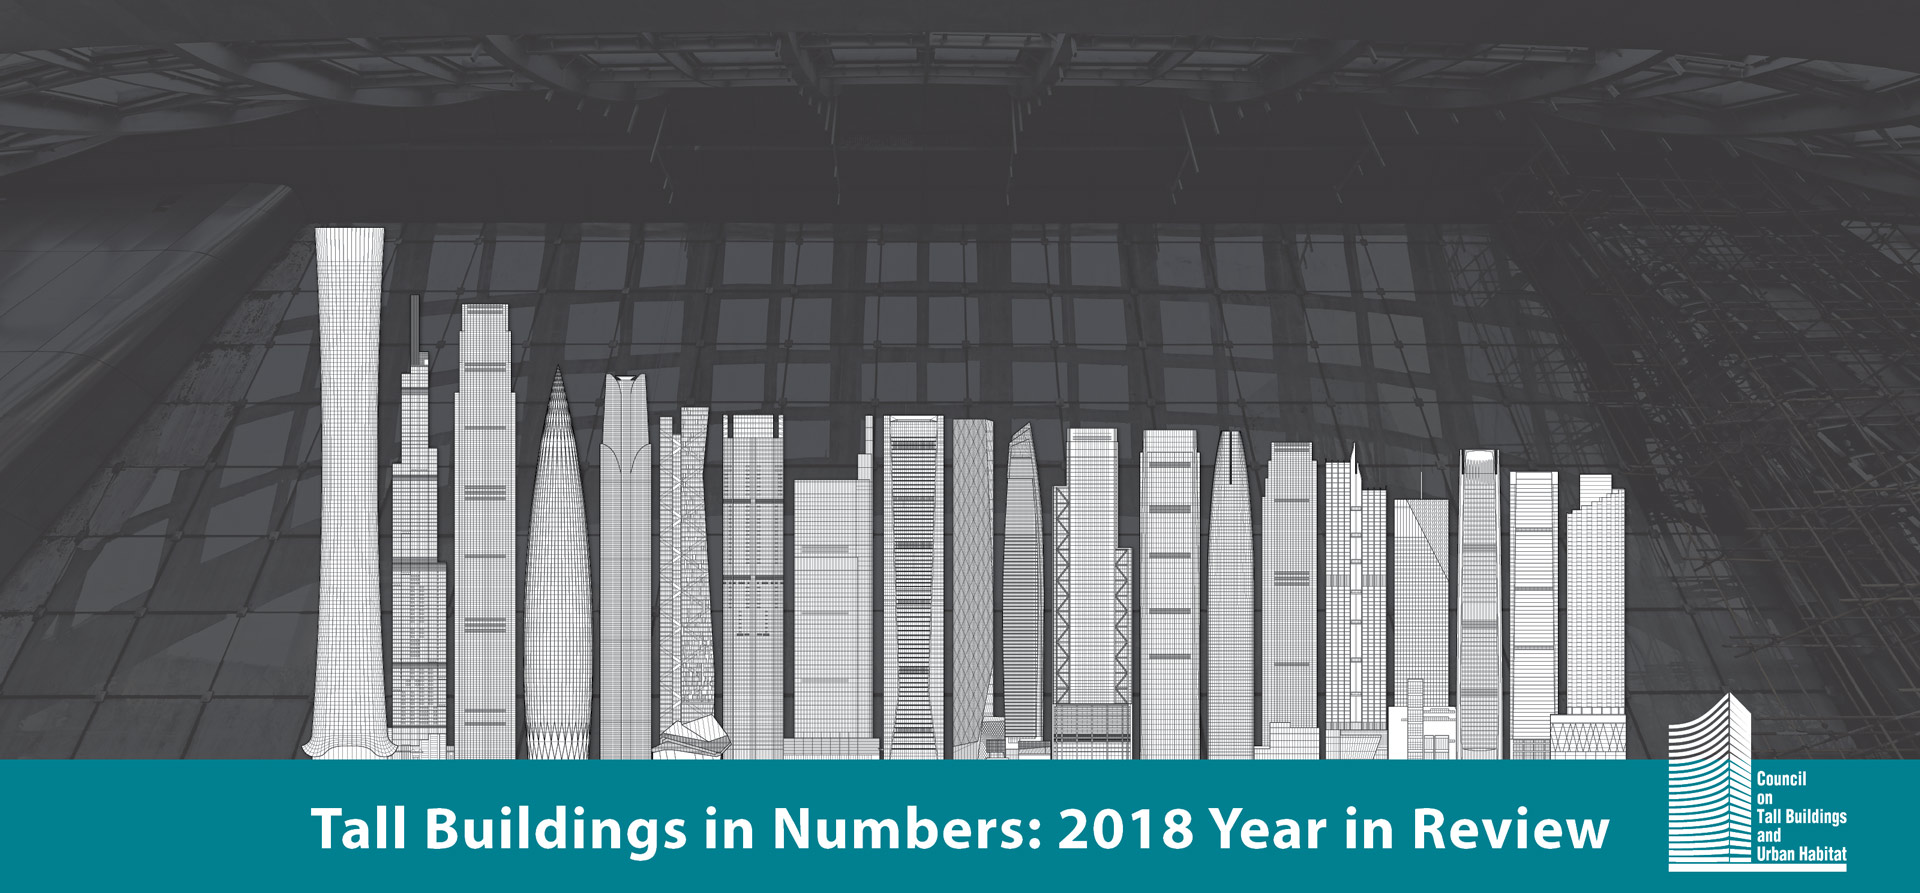
Skyline: Tallest 2018 Completions 2018 Tallest Skyline China Zun Vincom Landmark 81 Changsha IFS Tower T1 China Resources Tower Nanning Logan Century 1 Hanking Center Tower Four Seasons Place Comcast Technology Center One Shenzhen Bay Tower 7 Suning Plaza Tower 1 DAMAC Heights 3 World Trade Center Baoneng Center Salesforce Tower Changsha IFS Tower T2 Magnolias Waterfront Residences Tower 1 Honglou Times Square Guangfa Securities Headquarters Huaxun Center The Address Residence - Fountain Views I
 

The average height of 200-meter-plus buildings completed in 2018 was 247 meters, a slight increase over the 244-meter figure for 2017. The average height of the World’s 100 Tallest Buildings grew again, to 381 meters, from 372 in 2017 meters. Meanwhile, the average height of the 20 tallest buildings completed in a given year again rose, to 353 meters in 2018, up from 350 meters in 2017.


The total number of 200-meter-and-higher buildings in the world is now 1,478, a 141 percent increase from 614, in 2010.


The number of individual cities that recorded at least one 200-meter-plus completion was 51 in 2018, down from a record high of 69 in 2017, representing 19 countries, against 23 countries in 2017.


Sixteen new buildings entered the 100 Tallest list in 2018, up from 14 in 2017. The all-time record of new entries to the 100 Tallest was set in 2011, with 18 buildings joining that year. Last year was the first in which a supertall building did not enter the 100 Tallest list.

List of 2018 Completions

Rank Building Name City Stories m ft
1 China Zun Beijing, China 108 528 1731
2 Vincom Landmark 81 Ho Chi Minh City, Vietnam 81 461 1513
3 Changsha IFS Tower T1 Changsha, China 94 452 1483
4 China Resources Tower Shenzhen, China 67 393 1288
5 Nanning Logan Century 1 Nanning, China 82 381 1251
6 Hanking Center Tower Shenzhen, China 73 350 1148
7 Four Seasons Place Kuala Lumpur, Malaysia 65 343 1124
8 Comcast Technology Center Philadelphia, United States 59 342 1121
9 One Shenzhen Bay Tower 7 Shenzhen, China 71 341 1120
10 Suning Plaza Tower 1 Zhenjiang, China 75 338 1109
11 DAMAC Heights Dubai, United Arab Emirates 88 335 1099
12 3 World Trade Center New York City, United States 69 329 1079
13 Baoneng Center Shenzhen, China 65 327 1074
14 Salesforce Tower San Francisco, United States 61 326 1070
= 15 Magnolias Waterfront Residences Tower 1 Bangkok, Thailand 70 315 1033
= 15 Changsha IFS Tower T2 Changsha, China 63 315 1033
17 Honglou Times Square Lanzhou, China 56 313 1027
18 Guangfa Securities Headquarters Guangzhou, China 59 308 1010
19 Huaxun Center Shenzhen, China 70 286 938
20 The Address Residence - Fountain Views I Dubai, United Arab Emirates 70 283 929
21 The Address Residence - Fountain Views II Dubai, United Arab Emirates 70 283 927
22 Lanzhou City Plaza Building 1 Lanzhou, China 60 281 920
23 Treasury Tower Jakarta, Indonesia 57 280 917
24 The Astaka Tower A Johor Bahru, Malaysia 73 279 915
25 Logan International Headquarters Tower 1 Nanning, China 58 278 912
26 Tianyue Xinchen Tower 1 Wuhan, China 43 275 903
27 Shenzhen Bay Ecocity B-Tech Tower 1 Shenzhen, China 58 273 896
= 28 Burj Vista Tower 1 Dubai, United Arab Emirates 63 272 892
= 28 Central Financial Street Tower Nanchang, China 58 272 892
= 28 Taipei Nan Shan Plaza Taipei, China 48 272 892
31 Greenland Center Tower 2 Xi’an, China 57 270 886
= 32 DAMAC Paramount Hotel & Residences Dubai, United Arab Emirates 69 268 879
= 32 DAMAC Towers by Paramount, Tower 1 Dubai, United Arab Emirates 69 268 879
= 32 DAMAC Towers By Paramount, Tower 2 Dubai, United Arab Emirates 69 268 879
= 32 DAMAC Towers by Paramount, Tower 3 Dubai, United Arab Emirates 69 268 879
= 36 Victoria Square 1 Dalian, China 68 268 879
= 36 Victoria Square 2 Dalian, China 68 268 879
= 38 Star Harbor International Centre East Tower Shanghai, China 50 263 863
= 38 Star Harbor International Centre West Tower Shanghai, China 50 263 863
= 40 BD Bacata Torre 1 Bogota, Colombia 67 260 853
= 40 Samsung China Headquarters Beijing, China 57 260 853
42 The Astaka Tower B Johor Bahru, Malaysia 67 256 839
43 One Bennett Park Chicago, United States 67 255 837
44 Poly International Center Liuzhou, China 53 253 829
45 Panorama Tower Miami, United States 81 252 828
46 South China International Wharf Service Center Guangzhou, China 55 250 820
47 Lianyungang Lu 66 Qingdao, China 56 250 820
48 One Museum Place Shanghai, China 54 249 816
49 Victoria One Melbourne, Australia 76 247 810
50 Shenzhen Bay Ecocity B-Tech Tower 2 Shenzhen, China 54 245 804
51 181 Fremont San Francisco, United States 54 244 802
52 MidValley Tower of Light Kuala Lumpur, Malaysia 56 243 797
53 Binhu Times Square Hefei, China 54 242 794
54 111 Murray Street New York City, United States 58 241 792
55 Yowe Center Kunming, China 47 239 784
= 56 Z14 Plot Tower 1 Beijing, China 48 238 781
= 56 Z14 Plot Tower 2 Beijing, China 48 238 781
58 520 Park Avenue New York City, United States 54 238 781
59 55 Hudson Yards New York City, United States 51 237 778
60 Atlantis Hotel Sanya Sanya, China 48 236 774
= 61 Alvear Tower Puerto Madero Buenos Aires, Argentina 56 235 771
= 61 WKL Hotel and Tropicana The Residences Kuala Lumpur, Malaysia 55 235 771
= 61 Frasers Tower Singapore, Singapore 38 235 771
64 Torre Paradox Mexico City, Mexico 62 234 768
= 65 Hangyang Sino Plaza 1 Nanning, China 53 232 760
= 65 Hangyang Sino Plaza 3 Nanning, China 53 232 760
= 67 19 Dutch Street New York City, United States 63 231 758
= 67 Kuwait Investment Authority Headquarters Kuwait City, Kuwait 50 231 758
= 67 China Resources Dachong Redevelopment Tower 1 Shenzhen, China 231 758
70 Tsinghua University Campus - Z1 Lot Beijing, China 50 231 758
= 71 Casa Domaine Tower 1 Jakarta, Indonesia 61 230 755
= 71 Elite Pavilion Kuala Lumpur, Malaysia 50 230 755
= 71 Westin Hotel Changsha, China 46 230 755
74 Equatorial Plaza Kuala Lumpur, Malaysia 55 230 754
75 One Taikoo Place Hong Kong, China 48 229 750
76 KWG International Plaza Nanning, China 50 228 748
77 Wanbo Tianhe Shopping Center Tower C Guangzhou, China 40 228 747
78 Dawangjing 618 Tower 1 Beijing, China 53 227 745
79 Hangyang Sino Plaza 2 Nanning, China 50 226 740
= 80 Suning Plaza Tower 2 Zhenjiang, China 62 225 738
= 80 Jinlitong Financial Center Tower 1 Shenzhen, China 46 225 738
= 80 Jinlitong Financial Center Tower 2 Shenzhen, China 46 225 738
= 80 Wuhan Central Trade Center B Wuhan, China 45 225 738
84 ARO New York City, United States 62 225 738
85 Ten York Toronto, Canada 65 224 735
86 Evergrande Liberation Monument Centre Tower 1 Chongqing, China 53 223 732
87 Skysuites Residential Tower Quezon City, Philippines 44 223 732
= 88 Nurol Life Istanbul, Turkey 60 220 722
= 88 Tianfu IFC 1 Chengdu, China 58 220 722
= 88 Tianfu IFC 2 Chengdu, China 58 220 722
= 88 Aoyuan International Center Guangzhou, China 50 220 722
= 88 Dawangjing 626 Tower 1 Beijing, China 44 220 722
= 88 Pauline's World City T1 Chongqing, China 41 220 722
94 China Resources Dachong Redevelopment Tower 2 Shenzhen, China 218 715
95 Shaanxi Yanchang Petroleum Headquarters Xi’an, China 46 217 713
= 96 Lucheng Plaza Tower 1 Xiamen, China 53 217 712
= 96 Tiandu Plaza Tower 1 Suzhou, China 217 712
98 100 East 53rd Street New York City, United States 61 217 711
= 99 BD Bacata Torre 2 Bogota, Colombia 56 216 709
= 99 Dawangjing 626 Tower 2 Beijing, China 40 216 709
101 Yanlord Marina Center Tower 5 Zhuhai, China 47 215 705
102 Changsha Yulin International Building C Changsha, China 44 215 704
103 Meera Tower Dubai, United Arab Emirates 52 213 699
104 Kanlong Taizi Hotel Wuhan, China 48 212 696
105 Zhengda International Plaza 7 Luoyang, China 50 212 695
106 East Harbour Place Tower 2 Dalian, China 62 211 691
= 107 Bashang Jie Global Center Residential Tower 1 Hefei, China 63 210 689
= 107 Fortune Center Residential Tower 3 Liuzhou, China 60 210 689
= 107 Yuda Group Headquarters Tower 1 Nanning, China 50 210 689
= 107 China Resources Center Tower A Liuzhou, China 47 210 689
111 Casa Domaine Tower 2 Jakarta, Indonesia 57 210 689
112 World Trade Center 3 Jakarta, Indonesia 44 209 686
113 Southern Bosera Building Shenzhen, China 42 208 682
114 Marina Gate I Dubai, United Arab Emirates 52 207 677
115 Victoria Mansion Tower 2 Dalian, China 60 206 677
116 Sequis Tower Jakarta, Indonesia 40 206 677
117 Aetna Sonnenschein International Plaza Rizhao, China 47 206 676
= 118 Golden View Central Park Tower A Busan, South Korea 58 205 673
= 118 Golden View Central Park Tower B Busan, South Korea 58 205 673
= 118 Golden View Central Park Tower C Busan, South Korea 58 205 673
= 118 277 Fifth Avenue New York City, United States 52 205 673
= 118 Golden Tower Jeddah, Saudi Arabia 50 205 673
= 118 Burj Alshaya West Tower Kuwait City, Kuwait 45 205 673
= 124 Shengjing Finance Plaza R10 Shenyang, China 60 205 672
= 124 Shengjing Finance Plaza R11 Shenyang, China 60 205 672
= 124 Shengjing Finance Plaza R12 Shenyang, China 60 205 672
127 ASHTON Chula-Silom Bangkok, Thailand 57 204 669
128 YC Condos Toronto, Canada 60 202 664
129 Singha Headquarters Bangkok, Thailand 37 201 660
130 China Resources Dachong Redevelopment Tower 3 Shenzhen, China 201 659
131 Blue Business Hong Kong Cultural Center Block F Hefei, China 43 201 659
= 132 Baoneng Shenyang Global Financial Centre Tower 3 Shenyang, China 56 200 656
= 132 Baoneng Shenyang Global Financial Centre Tower 4 Shenyang, China 56 200 656
= 132 Baoneng Shenyang Global Financial Centre Tower 5 Shenyang, China 56 200 656
= 132 Baoneng Shenyang Global Financial Centre Tower 6 Shenyang, China 56 200 656
= 132 Baoneng Shenyang Global Financial Centre Tower 7 Shenyang, China 56 200 656
= 132 China Life Tower 1 Jinan, China 47 200 656
= 132 China Life Tower 2 Jinan, China 47 200 656
= 132 Zhuhai Hengqin Xinqu Ahongda Finance Tower 1 Zhuhai, China 47 200 656
= 132 Kwong Wo Mukden Center 1 Xi’an, China 45 200 656
= 132 Jumeirah Hangzhou Hotel Hangzhou, China 43 200 656
= 132 Gezhouba Nanda Tiandi Wuhan, China 42 200 656
= 132 Das Intellitech Headquarters Shenzhen, China 40 200 656
= 132 Victoria Mansion Tower 1 Dalian, China 57 200 656

Top 30 Projected 2019 Completions

Rank Building Name City Stories m ft
1 Tianjin CTF Finance Centre Tianjin, China 97 530 1739
2 Lakhta Center St. Petersburg, Russia 87 462 1516
3 The Exchange 106 Kuala Lumpur, Malaysia 97 452 1483
4 Suzhou IFS Suzhou, China 98 450 1476
5 Wuhan Center Tower Wuhan, China 88 438 1437
7 111 West 57th Street New York City, United States 82 435 1428
8 Guangxi China Resources Tower Nanning, China 85 403 1321
9 Shum Yip Upperhills Tower 1 Shenzhen, China 80 388 1273
10 30 Hudson Yards New York City, United States 73 387 1268
11 Dalian International Trade Center Dalian, China 86 370 1214
12 Golden Eagle Tiandi Tower A Nanjing, China 76 368 1208
= 13 Raffles City Chongqing T3N Chongqing, China 79 355 1163
= 13 Raffles City Chongqing T4N Chongqing, China 79 355 1163
15 Xi An Glory International Financial Center Xi’an, China 75 350 1148
16 Spring City 66 Kunming, China 61 349 1145
17 Xiamen Cross Strait Financial Centre Xiamen, China 68 344 1128
= 18 Twin Towers Guiyang, East Tower Guiyang, China 74 335 1099
= 18 Twin Towers Guiyang, West Tower Guiyang, China 74 335 1099
20 The Address Residence - Fountain Views III Dubai, United Arab Emirates 77 331 1087
21 Golden Eagle Tiandi Tower B Nanjing, China 68 328 1076
22 53 West 53rd New York City, United States 77 320 1050
23 FIVE Jumeirah Village Dubai Dubai, United Arab Emirates 65 314 1030
24 Guangxi Wealth Financial Center Nanning, China 70 311 1020
25 35 Hudson Yards New York City, United States 72 308 1009
= 26 Amna Tower Dubai, United Arab Emirates 75 307 1007
= 26 Noora Tower Dubai, United Arab Emirates 75 307 1007
27 International Trade Center Zhongshan, China 65 305 1001
28 One Manhattan West New York City, United States 67 303 995
= 29 Golden Eagle Tiandi Tower C Nanjing, China 60 300 984
= 29 OCT Tower Shenzhen, China 60 300 984